
Key Takeaways
- Pick one primary metric: Use CSAT for touchpoints, NPS for loyalty, or CES for effort -- then add 1 open-text follow-up to explain the score.
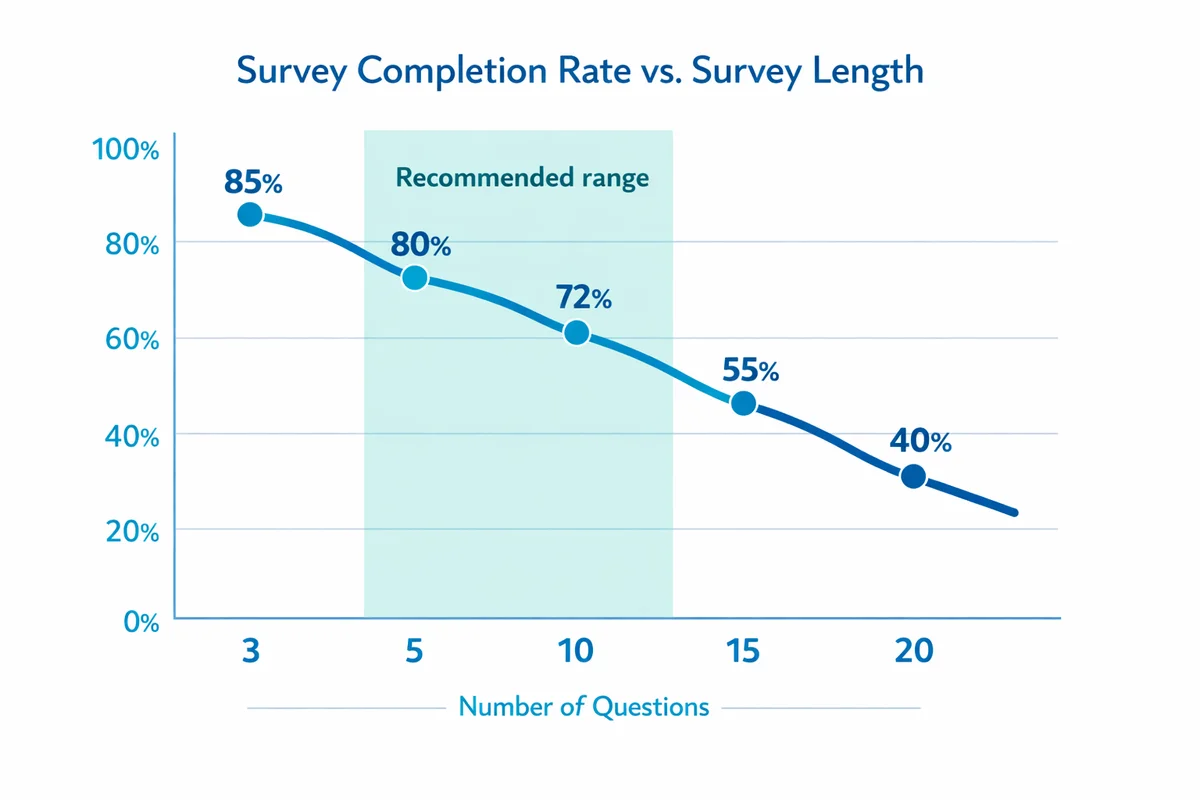
- Keep it short and specific: 5-10 questions, consistent scales, and one topic per question improves completion and makes results easier to act on.
- Match channel to moment: Trigger surveys right after key events (purchase, delivery, support closure) and choose email, in-app, SMS, or QR based on how customers interact with you.
- Plan analysis before you send: Define segments, targets, and thresholds up front so you can prioritize fixes instead of arguing about what the numbers mean.
- Close the loop: Categorize feedback, assign owners, follow up with detractors/unhappy customers, and publish "You said, we did" updates to build trust.
What a customer satisfaction survey is (and what it is not)
A customer satisfaction survey is a structured set of questions you send to customers to measure how satisfied they are with a specific experience (a touchpoint like a support ticket) or with your offering overall (like the product or the brand relationship).
It is not a replacement for operational metrics (refund rate, churn, repeat purchase) or qualitative research (interviews, usability tests). Surveys tell you how customers rate an experience and why in their own words, at scale.
If you need a refresher on the bigger concept and how satisfaction fits into loyalty and retention, start with our customer satisfaction overview.
For B2B, your "customer" might be an account with multiple roles (admin, end user, finance). Decide whose experience you are measuring before you write questions or sample.
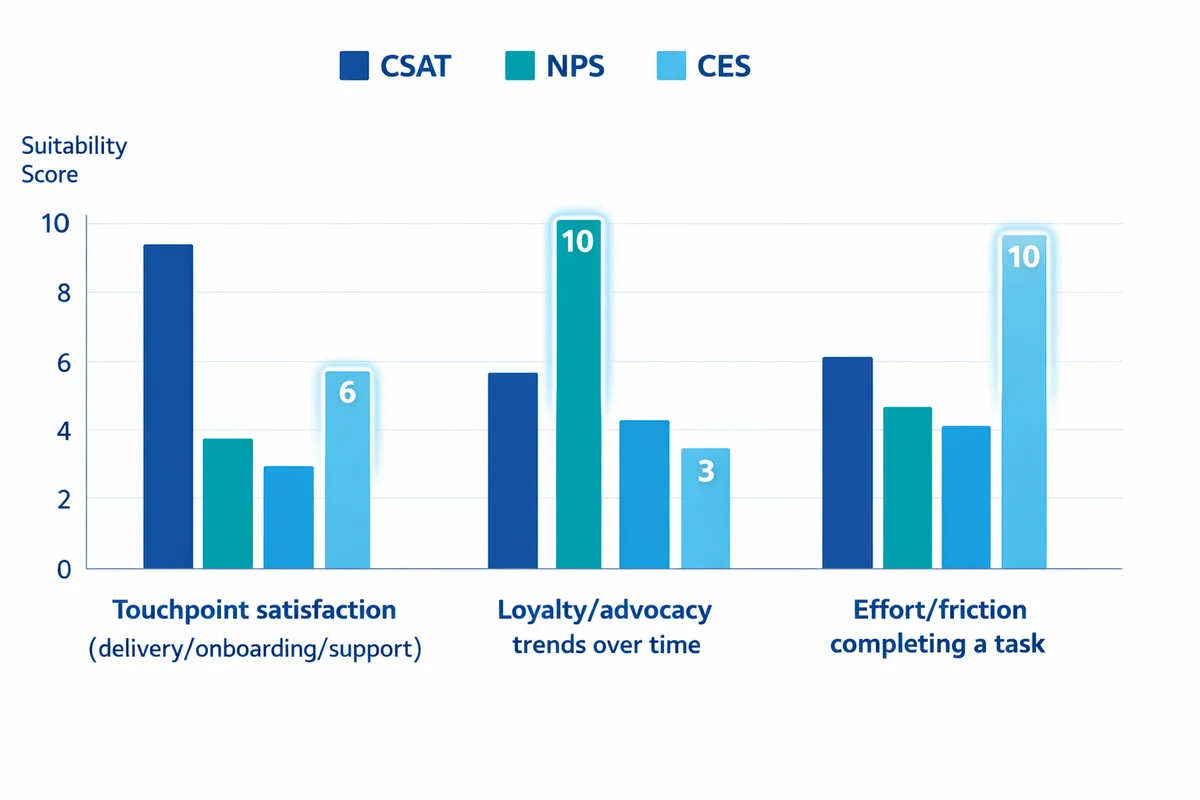
Choose the right metric: CSAT vs NPS vs CES
Most satisfaction programs work better when you choose one primary metric and treat everything else as diagnostic. Otherwise, teams end up debating which number is "real" instead of fixing issues.
| Metric | Best for | Typical question | Reporting unit | Common mistake |
|---|---|---|---|---|
| CSAT (Customer Satisfaction) | Measuring satisfaction with a specific interaction (delivery, onboarding, support) | "How satisfied were you with [experience]?" | % satisfied (often top-2 box) | Using different scales across teams so scores are not comparable |
| NPS (Net Promoter Score) | Tracking loyalty/advocacy trends over time | "How likely are you to recommend us to a friend or colleague?" | NPS = %Promoters - %Detractors | Treating NPS as a touchpoint metric when it is usually relationship-level |
| CES (Customer Effort Score) | Understanding friction: how hard it was to do something | "How easy was it to resolve your issue today?" | Average or % easy | Asking about "effort" when the customer did not attempt a task |
If you are launching your first survey, CSAT is often the easiest place to start because it maps cleanly to specific moments you can improve. For relationship tracking (quarterly/biannual), consider pairing NPS with one or two driver questions.
Be aware that measurement choices change results (scale labels, question context, and ordering effects). This is a known issue in satisfaction measurement research, so treat comparisons across different survey designs with caution. Drew and Bolton (1991) discuss how survey measurement can affect observed satisfaction patterns.
How to calculate CSAT (a practical approach)
A common CSAT calculation is the percent of respondents who selected the top 2 options on a 5-point satisfaction scale (for example, "Satisfied" or "Very satisfied").
- Define "satisfied" once: Decide whether you will use top-1, top-2, or a threshold like 4+ on a 1-5 scale, then keep it consistent.
- Report the denominator: Always show the number of responses (n) alongside CSAT so leaders can judge stability.
Plan who to survey (sampling), when to send, and how often
Before you write questions, decide three things: (1) the event that triggers the survey, (2) who is eligible, and (3) how you will avoid over-surveying the same people.
Eligibility and sampling rules
Some teams survey every eligible customer. Others sample to reduce cost, avoid fatigue, or ensure balanced coverage across segments. If you need a quick primer, see our guide to who to survey and how to sample.
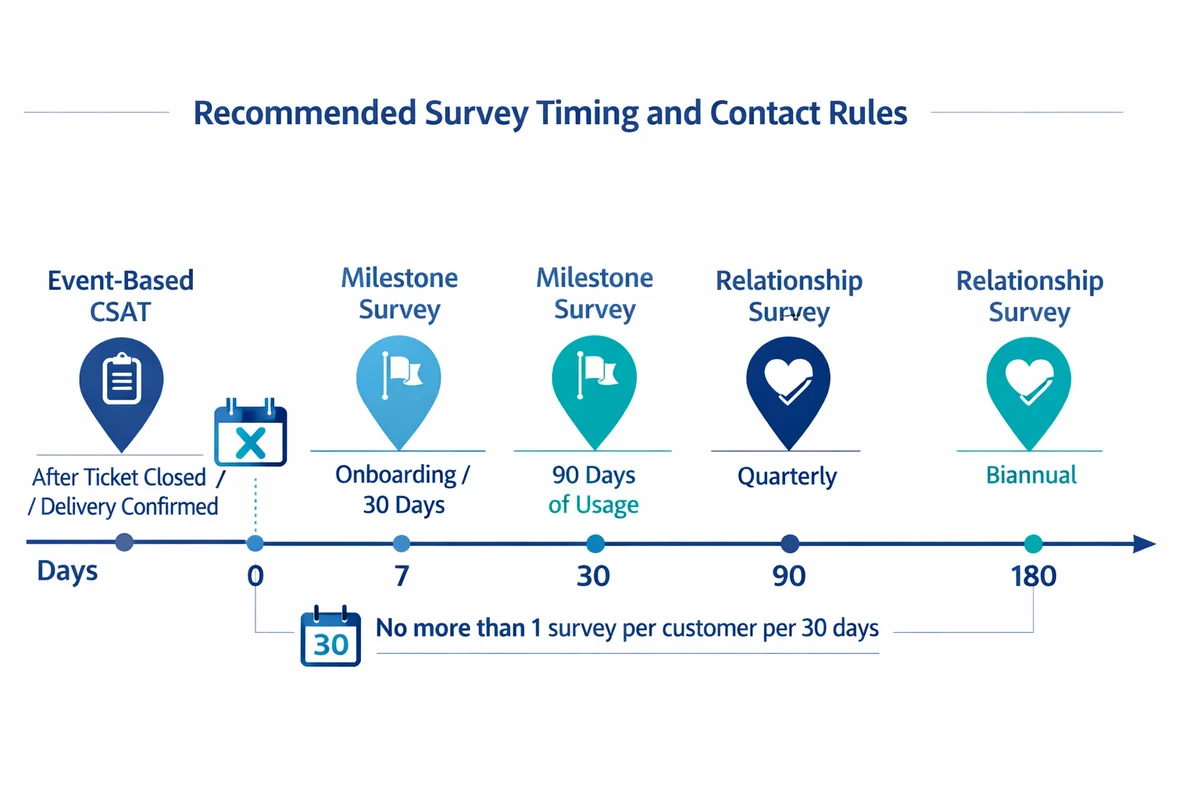
- Event-based CSAT: Survey after a completed interaction (ticket closed, delivery confirmed, appointment finished).
- Milestone surveys: Survey after onboarding completion or 30/90 days of product usage.
- Relationship surveys: Survey on a schedule (quarterly, biannual) to track overall sentiment.
Timing guidelines by channel
Send the survey as close to the experience as possible. Delays introduce recall error (people forget details and answer more generally). When you cannot send immediately, include context in the invitation (order number, date, ticket topic).
Set contact rules (for example: no more than one survey per customer per 30 days, and never two surveys in the same week). This protects response rates and goodwill.
Sample size: enough to trust differences
Your needed sample size depends on how precise you need to be and whether you are comparing segments (region, plan type, channel) or tracking changes over time. Use our sample size guidance to plan targets and avoid over-interpreting small swings.
Design the survey: structure, scales, and bias traps
A strong customer satisfaction survey has a simple flow: (1) a core metric question, (2) one diagnostic follow-up (what drove the rating), (3) one open-text question, and (4) optional segmentation or permission-to-contact items.
Pick a scale and stay consistent
Use one satisfaction scale across touchpoints unless you have a compelling reason to change. Mixed scales make dashboards harder to read and reduce comparability.
- If you want agreement-style statements ("I was able to..."), use Likert scale questions.
- If you want a direct rating (satisfaction, ease, quality), use rating scale questions and keep labels clear on endpoints.
Common response bias issues (and how to prevent them)
Satisfaction data is sensitive to wording, context, and who chooses to respond. A quick overview of pitfalls is in our guide to response bias.
- Leading wording: "How great was..." pushes scores up. Use neutral language.
- Double-barreled items: "Speed and quality" forces one answer for two topics.
- Nonresponse bias: People with very positive or very negative experiences respond more. Use broad sampling and consistent triggers to reduce skew.
For more on writing clear, unambiguous items, see tips for writing clear survey questions.
Customer satisfaction survey questions (by goal and touchpoint)
Below are practical question sets you can mix and match. Keep your live survey short: choose the questions that match the decision you want to make.
1) Core CSAT question (touchpoint)
- CSAT (5-point): "Overall, how satisfied were you with [support experience/delivery/checkout]?" (Very dissatisfied, Dissatisfied, Neutral, Satisfied, Very satisfied)
- CSAT (7-point): Use only if you truly need more granularity; otherwise 5-point is easier to answer consistently.
2) Driver questions (what to fix)
- "What was the main reason for your score?" (Multiple choice: speed, clarity, product quality, staff helpfulness, issue resolution, cost, other)
- "Which part of the process needs the most improvement?" (Select one)
- "Did we resolve your issue today?" (Yes/No)
3) CES questions (friction)
- "How easy was it to complete [task]?" (Very difficult to Very easy)
- "What made it difficult?" (Multiple choice + Other)
4) Relationship questions (overall sentiment)
- "How satisfied are you with us overall?" (5-point satisfaction)
- "How well do we meet your needs?" (Not at all well to Extremely well)
- "How likely are you to continue using us over the next 3 months?" (0-10 or 5-point likelihood)
5) One open-ended follow-up (do not skip this)
Open-text responses supply the "why" that scores cannot. Keep it to one question and place it immediately after the rating so context is fresh. See our guide to how to use open-ended follow-ups.
- "What is the main thing we could do to improve your experience?"
- "What went well, and what did not?"
- "If you could change one thing about [process/product], what would it be?"
6) Optional segmentation and permission-to-contact
- "Which of the following best describes your plan/tier?" (Basic/Pro/Enterprise)
- "Which channel did you use today?" (Phone/Chat/Email/Self-service)
- "May we contact you about your feedback?" (Yes/No)
If you ask for email, account ID, order number, or agent name, limit access and define retention rules. See survey privacy and data security for practical safeguards.
A ready-to-use customer satisfaction survey template (copy and edit)
If you want a fast start, use our customer satisfaction survey template. Below is a copy-and-edit version you can adapt for most touchpoints.
Q1 (Core metric)
How satisfied were you with [touchpoint]? (5-point satisfaction scale)
Q2 (Reason)
What is the main reason for your score? (Select one: speed, quality, clarity, helpfulness, ease, cost, other)
Q3 (Resolution, if support)
Was your issue resolved? (Yes/No/Not sure)
Q4 (Effort, if task-based)
How easy was it to complete [task]? (Very difficult to Very easy)
Q5 (Open text)
What is the main thing we could do to improve? (Open-ended)
Q6 (Permission)
May we follow up with you about your feedback? (Yes/No)
Q7 (Contact, conditional)
If yes, what is the best email or phone number to reach you? (Short text)
Need variations (restaurant, ecommerce, onboarding, support, etc.)? Browse our satisfaction survey templates by use case.
Distribution strategy: channels, invitations, and response rate levers
Most competitors list channels; fewer explain when each channel works best and what to adjust when responses are low. Use the channel that matches the moment customers are already paying attention.
| Channel | Best moments | Strengths | Watch-outs |
|---|---|---|---|
| Post-purchase, post-delivery, relationship surveys | Rich context, longer surveys possible, easy to personalize | Inbox clutter; delays reduce recall; watch contact rules | |
| In-app / product prompt | After completing a workflow, feature usage, onboarding milestone | High relevance, immediate timing, can target segments | Interruptive; keep it very short (1-3 questions) |
| SMS | On-the-go services, appointments, deliveries | Fast opens; good for 1-2 questions | Privacy expectations; strict opt-in; avoid long forms |
| Web intercept | Checkout, help center, cancellation flow | Captures feedback from active users | Sampling bias toward current visitors; avoid blocking tasks |
| QR code (receipt, signage) | In-person experiences, events, stores | Simple; ties to a physical moment | Low effort to ignore; keep it short and mobile-friendly |
Invitation copy that improves completion
- Use a specific subject: "Quick question about your delivery on Feb 12" beats "Customer survey".
- Set expectations: "2 minutes" or "3 questions" (only if true).
- Explain the benefit: "Your feedback helps us fix [process]" is stronger than generic "We value your feedback".
- Keep the link clean: One clear CTA button; avoid multiple links that distract.
Trigger design: event-based is usually better than batch
Batch sends (weekly or monthly) are easier operationally, but they blend experiences together and reduce actionability. Event-based triggers create a tighter connection between the score and the team that can fix the issue.
- Do not over-survey: Add a cooldown window (for example, 30 days) per person or per account.
- Sample fairly: If you throttle volume, do it randomly within each key segment so one region or plan does not dominate.
- Close the loop quickly: If you plan to follow up with unhappy customers, get the survey in within hours/days, not weeks.
Analyze results: make scores actionable (not just reportable)
Analysis should answer three practical questions:
- What is happening? (scores and trends)
- Where is it happening? (segments and touchpoints)
- Why is it happening? (drivers and verbatims)
Build a simple reporting view
At minimum, report:
- CSAT (or your chosen metric) with response count (n)
- Top reasons (from your driver multiple-choice question)
- Top themes from open-text (coded categories)
- Breakouts by 1-3 key segments (channel, product line, region)
If you need an external benchmark for directional context (not a target), the American Customer Satisfaction Index (ACSI) is one well-known approach to standardized satisfaction measurement. For background, see Fornell et al. (1996) and the ACSI methodology documentation.
Turn open-text into themes you can assign
A lightweight coding process usually beats fancy dashboards:
Create 8-15 categories
Examples: speed, product quality, billing, usability, support knowledge, communication, policy, reliability.
Code a sample first
Review 50-100 comments, refine categories, then code the rest consistently.
Assign owners
Each category should map to a team that can take action (Operations, Product, Support, Billing).
Service quality measurement often requires multiple items that reflect reliability, responsiveness, assurance, empathy, and tangibles -- not a single vague question.
Parasuraman, Zeithaml, and Berry (1988)
You do not need to run SERVQUAL to run a CSAT survey, but the underlying idea is useful: if you want to improve service, measure the dimensions you can actually change.
Report responsibly (avoid misleading precision)
When sharing results internally, follow basic quality principles: document who was surveyed, how, and when; disclose response rates; and avoid overstating what the data can support. See the U.S. Bureau of Labor Statistics guidelines on information quality and methodology for a clear, plain-language standard.
Close the feedback loop: prioritize fixes, follow up, and prove change
Closing the loop is the difference between "we collected feedback" and "we improved customer experience". Build a repeatable workflow so feedback turns into decisions.
A practical closed-loop workflow
Step 1: Triage
Set thresholds (for example: CSAT 1-2, or NPS detractors) that trigger review within 24-48 hours.
Step 2: Route to an owner
Send the case to the team that can fix it (Support manager, Product owner, Ops lead). Include the score, comment, and context.
Step 3: Follow up with the customer
When appropriate, contact the customer to understand details, apologize if needed, and describe next steps. Keep it human and specific.
Step 4: Classify as "quick fix" vs "systemic"
Quick fix: one-off mistake, training gap. Systemic: policy, tooling, product defect, process bottleneck.
Step 5: Implement and verify
Make the change, then verify it reduced the issue (trend, comment volume, operational KPI).
Step 6: Communicate back
Publish "You said, we did" updates to customers or users when changes are meaningful. This increases trust and future response rates.
How to prioritize what to fix first
Use a simple prioritization grid. You do not need a complex model to improve decision quality.
| Dimension | How to score (1-5) | Examples |
|---|---|---|
| Customer impact | How strongly it affects satisfaction or effort | Checkout errors, unresolved tickets, billing mistakes |
| Frequency | How often it appears in feedback | "Shipping delays" mentioned in 30% of comments |
| Business risk | Churn risk, compliance, reputation | Data access issues, repeated outages |
| Effort to fix | Engineering/ops cost and time | Copy change vs major architecture change |
Then start with items that are high impact, high frequency, and low-to-moderate effort. Track the rest as a roadmap with clear owners.
Run it as a program: governance, cadence, and continuous improvement
Satisfaction surveys work best when they are treated as an ongoing measurement system, not a one-time project.
- Set a cadence: weekly touchpoint reviews, monthly trend summaries, quarterly deep dives.
- Document the instrument: question wording, scales, trigger rules, sampling rules, and any changes.
- Control changes: if you change wording or scales, mark a break in the trend line and avoid claiming apples-to-apples comparisons.
If you work in regulated or public-service contexts, you may find it helpful to review an example of a standardized satisfaction instrument approach such as the U.S. Office of Personnel Management customer satisfaction survey page for framing and documentation practices.
Example: "This quarter we will learn whether delivery communication or delivery speed drives dissatisfaction." Align questions and reporting to that goal, then retire extra questions.
Launch checklist and next steps
Use this checklist to ship a survey that is measurable, respectful, and actionable.
- Goal and decision: We know what decision this survey will support (fix a process, compare channels, track trend).
- Primary metric chosen: CSAT, NPS, or CES is the headline; everything else is diagnostic.
- Survey length controlled: 5-10 questions max; one open-text question.
- Sampling rules set: Eligibility, throttling, cooldown, and segment coverage documented.
- Closed-loop workflow: Thresholds, owners, and follow-up scripts are ready.
- Privacy reviewed: Identifier collection, access, and retention follow your policy.
When you are ready to build and send your survey, you can create a customer satisfaction survey in SuperSurvey and start collecting feedback.
References
- Drew, J. H., & Bolton, R. N. (1991). The structure of customer satisfaction: Effects of survey measurement. Journal of Consumer Satisfaction, Dissatisfaction and Complaining Behavior, 4.
- Parasuraman, A., Zeithaml, V. A., & Berry, L. L. (1988). SERVQUAL: A multiple-item scale for measuring consumer perceptions of service quality. Journal of Retailing, 64(1), 12-40.
- Fornell, C., Johnson, M. D., Anderson, E. W., Cha, J., & Bryant, B. E. (1996). The American Customer Satisfaction Index: Nature, purpose, and findings. Journal of Marketing, 60(4), 7-18.
- American Customer Satisfaction Index (ACSI). (n.d.). ACSI methodology (official documentation).
- U.S. Bureau of Labor Statistics. (2002). BLS guidelines for informing users of information quality and methodology.
- U.S. Office of Personnel Management. (n.d.). Customer satisfaction survey (Buy Services / Employee Surveys).
Frequently Asked Questions
How long should a customer satisfaction survey be?
For most touchpoints, 5-10 questions is plenty: one core metric (CSAT/CES), one driver question, one open-ended follow-up, and optional segmentation. In-app and SMS surveys should usually be 1-3 questions.
What is a good CSAT score?
It depends on your industry, customer expectations, and how you calculate CSAT (top-1 vs top-2 box). Focus first on internal trend and segment gaps, then look at external benchmarks for directional context (for example, ACSI methodology for standardized measurement).
When is the best time to send a CSAT survey?
Send it as close to the experience as possible: right after checkout, delivery confirmation, or ticket closure. If you must delay, include context (date, order/ticket reference) to reduce recall problems.
Should I use a 5-point or 7-point satisfaction scale?
Use 5-point unless you have a clear need for more granularity and your audience is comfortable with surveys. The bigger risk is inconsistency: pick one scale and keep it stable so you can compare scores over time.
Do I need to ask for customer name or email?
Only if you have a closed-loop follow-up process and a privacy plan. Many programs collect feedback anonymously for trend tracking, and ask permission to contact only when a follow-up is needed.
How do I improve response rates without incentives?
Focus on relevance and timing: send right after the event, keep it short, personalize the invitation, and explain how feedback will be used. Also set contact rules so customers are not surveyed too often.