
Key Takeaways
- Sampling = selecting a subset: You study a sample to learn about a larger population when a full census is not feasible.
- Start with definitions: Clearly specify your target population, sampling frame (your list), and sampling unit (who/what gets selected).
- Probability vs non-probability: Use probability sampling when you need defensible population estimates; use non-probability when exploration, hard-to-reach groups, or qualitative depth is the priority.
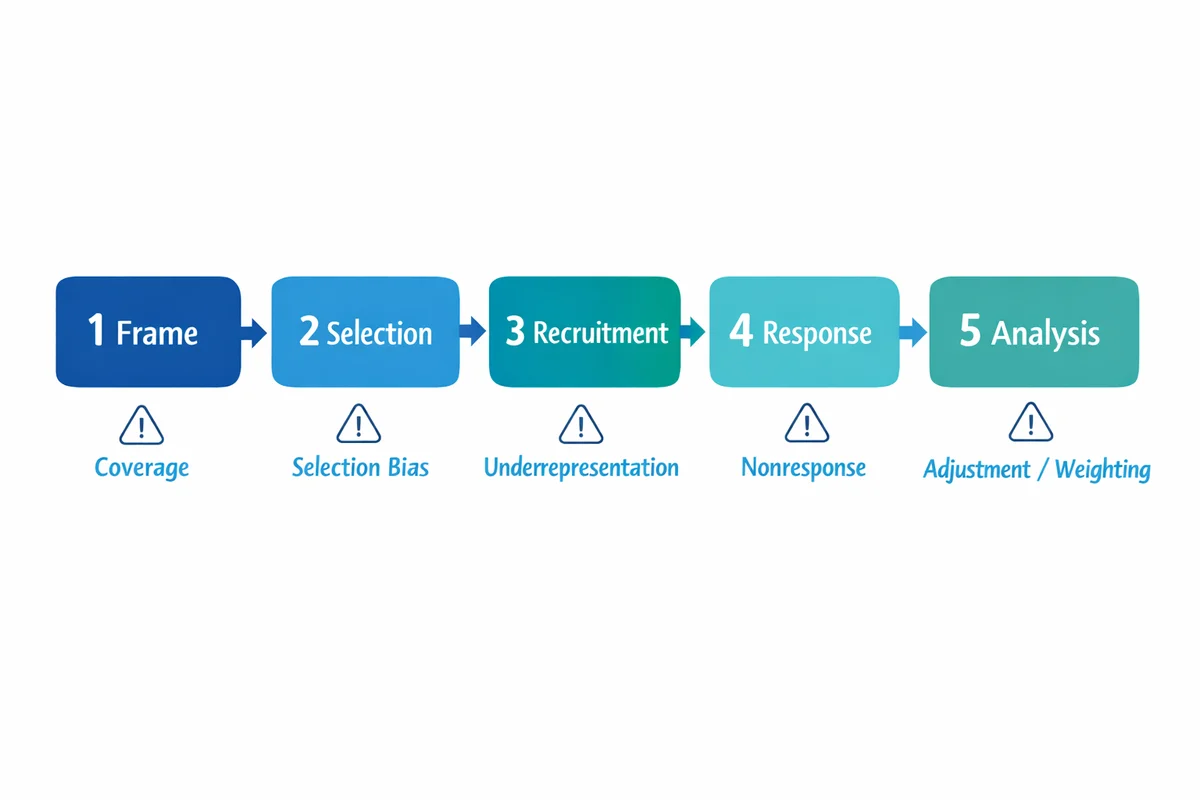
- Representativeness is a process: It depends on coverage (frame quality), selection, recruitment, and response -- not just the method name.
- Sample size is planning, not math: Decide the precision you need (margin of error), adjust for design effects and subgroup reporting, then inflate for expected nonresponse.
Sampling definition (and the 5 terms you must get right)
Sampling is the process of selecting a smaller group (a sample) from a larger group (a population) so you can learn about the population without measuring everyone. A full-population study is often impractical, so researchers sample to make the work feasible while still producing useful conclusions.
This article builds on our sampling (definition) overview and shows how sampling fits into research methods basics so you can choose a method you can defend.
- Population: The full group you want to describe (for example, "all active customers in Q2" or "all nurses working night shift").
- Target population vs accessible population: Who you want to study vs who you can actually reach with your recruitment and tools.
- Sampling frame: The list or mechanism you sample from (customer email list, employee roster, voter file, clinic schedule). Frame problems create coverage error.
- Sampling unit: What gets selected (a person, household, store, class, or appointment slot). In cluster designs, units can be groups.
- Representativeness: How well your achieved sample matches the population on characteristics that matter for your outcome (not necessarily on everything).
You can do "random sampling" and still end up with a biased achieved sample if your frame misses segments (coverage) or if some groups do not respond (nonresponse). Treat sampling as a chain: frame -> selection -> recruitment -> response -> analysis.
For a short, official definition, see the U.S. Office of Research Integrity's training note on sampling (ORI, Elements of Research: Sampling).
Why sampling matters (what your data can and cannot support)
Sampling choices determine what you can credibly claim from your results. If your sample is well designed and well executed, you can estimate population values (percentages, means) with known uncertainty. If it is not, you may still learn something, but generalizing becomes risky.
This is closely tied to data quality. "Bad" sampling often looks like clean spreadsheets but produces unstable, misleading estimates because key groups are undercovered, underrecruited, or underrepresented.
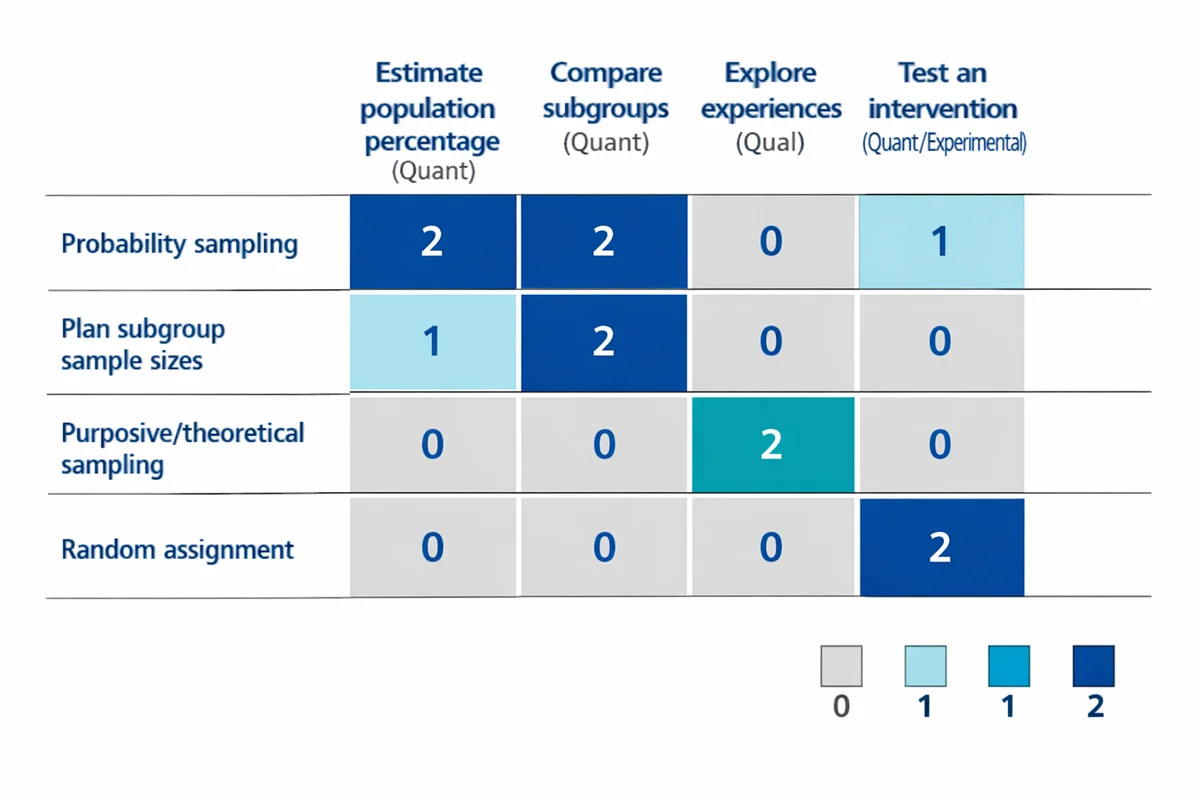
| If your goal is... | Sampling implication | Common trap |
|---|---|---|
| Estimate a population percentage (quant) | Prefer probability sampling; track response; compute precision (margin of error or intervals). | Assuming convenience samples give "population" results. |
| Compare subgroups (quant) | Plan for subgroup sample sizes (often via stratification/oversampling). | Reporting small subgroups with large uncertainty. |
| Explore experiences and mechanisms (qual) | Purposive/theoretical sampling may be appropriate; justify coverage of perspectives. | Chasing a numeric "minimum n" without a rationale. |
| Test an intervention (quant/experimental) | Sampling affects external validity; random assignment affects internal validity. | Confusing random assignment with random sampling. |
For a plain-language overview of survey inference (how samples support population estimates), see the U.S. Census Bureau's overview of survey sampling and inference (U.S. Census Bureau, Sampling Estimation & Survey Inference).
A practical sampling workflow (from research question to achieved sample)
Before you pick a technique, pin down the decision your study needs to support. Sampling is not a standalone choice; it is part of your research design.
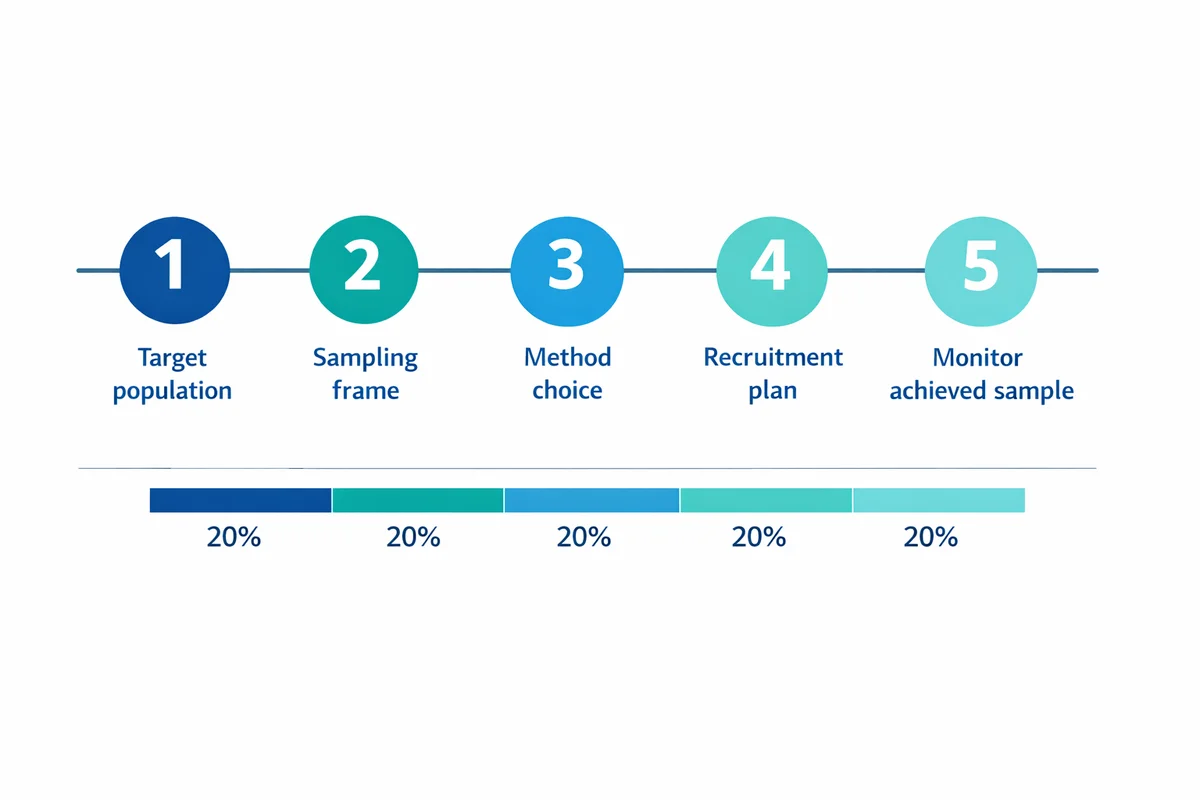
Define the target population
Before you make a free survey write it as a sentence with time and boundaries: who, where, when. Example: "Employees in department X who have been employed for 90+ days as of March 1."
Identify your sampling frame
What list or mechanism will you draw from? Audit it for missing groups, duplicates, and outdated records. If your frame excludes key segments, no sampling method can fully fix it.
Choose a sampling method that matches your inference goal
If you need population estimates with defensible uncertainty, use probability methods. If you are exploring or working with hard-to-reach groups, use non-probability methods with transparent limitations.
Plan recruitment and contact strategy
Selection is not the same as participation. Specify contact modes, reminders, incentives (if any), and language accessibility. Inclusive recruitment can reduce systematic underrepresentation (see UK Government guidance on inclusive research practices).
Monitor achieved sample vs plan
Track response rates and composition by key variables (region, role, tenure, channel). If gaps emerge, adjust outreach, add strata/quotas, or extend field time.
Probability sampling methods (random, but not casual)
Probability sampling means every unit in the frame has a known, non-zero chance of selection. This is what allows stronger population inference because selection is controlled by a random mechanism rather than researcher judgment.
| Method | How it works | Best when | Watch-outs |
|---|---|---|---|
| Simple random | Select n units purely at random from the frame. | You have a clean list and need straightforward estimates. | Hard if the list is messy; may underfill small subgroups unless n is large. |
| Systematic | Pick a random start, then select every k-th unit on an ordered list. | You want a simple operational procedure on a long list. | Risk of periodicity if the list ordering aligns with patterns (shift schedule, geography). |
| Stratified | Split the frame into strata (groups), sample within each stratum. | You need reliable subgroup estimates or want to guarantee representation. | Requires good stratum variables on the frame; analysis may need weights. |
| Cluster / multistage | Randomly sample groups (clusters) first (schools, stores), then sample within them. | A full list of individuals is not available, but a list of clusters is. | Often increases variance (design effect); sample size must account for it. |
Simple random sampling (SRS)
Use SRS when you have a complete, deduplicated list and you do not need guaranteed subgroup representation. SRS is a baseline method often used in textbooks because it is easy to describe and analyze.
- Example: Randomly select 800 customer IDs from a CRM list of 40,000 active customers.
- Tip: Document your randomization procedure (software, seed, date) so the selection is reproducible.
Systematic sampling
Systematic sampling is operationally convenient: sort your frame, pick a random start, then take every k-th record. It can approximate SRS if the order is unrelated to your outcome.
- Example: From a list of 12,000 appointments, take every 15th appointment after a random start to target 800 patients.
- Avoid: Ordering by clinic, day, or time block if those correlate with outcomes.
Stratified sampling
Stratified sampling is the most practical "upgrade" when you must report by key groups. Choose strata that are strongly related to the outcome or to differential response, and that you can measure reliably on the frame. Common strata include region, tenure, plan type, role, and age bands.
If you need ideas for what variables are typically available and how to ask for them, see demographic information guidance (also useful when you need to collect missing stratum variables inside the survey).
- Proportional stratification: Sample each stratum in proportion to its population size (simpler weighting).
- Disproportionate stratification (oversampling): Sample more from small but important strata (then weight during analysis).
Cluster and multistage sampling
Cluster sampling reduces field cost when individuals are naturally grouped and you cannot get a full individual list. The tradeoff is that people within clusters can be similar, reducing effective sample size. Plan for this in your sample size (see the sample size section below).
- Example: Randomly select 25 stores (clusters) and then survey 40 customers per store.
For research-oriented summaries of common sampling methods in practice, see Spolarich (2023) and Elfil and Negida (2017) in the References section.
Non-probability sampling methods (useful, but be explicit about limits)
Non-probability sampling means selection probabilities are unknown. This can be appropriate when you cannot build a usable sampling frame, when speed matters, or when your goal is exploration rather than population estimation.
The discipline is in (1) defining who you tried to include, (2) documenting recruitment channels, (3) checking sample composition, and (4) writing limitations that match what you actually did.
- Convenience sampling: Recruit whoever is easiest to access (website pop-up, in-app survey, classroom). Fast, but often biased toward the most reachable/most engaged.
- Quota sampling: Set targets (quotas) for key groups (for example, 50% new customers, 50% returning) and recruit until filled. Improves balance, but still not probability-based.
- Purposive (judgment) sampling: Deliberately recruit cases that fit criteria (subject-matter experts, high-usage customers, frontline staff). Common in qualitative research.
- Snowball sampling: Participants refer others. Useful for hard-to-reach or networked populations; watch for homophily (people refer similar people).
In qualitative work, you may also see language like "theoretical sampling" (iteratively selecting participants to refine concepts). A concise statement that distinguishes quantitative sample justification from qualitative rationale appears in the University of Bath guide (Sampling in research).
How to choose a sampling method (a decision guide you can defend)
Most teams do not fail because they picked the "wrong" named technique. They fail because the technique did not match the decision need, the frame, or the operational reality of recruiting respondents.
Start with the decision and the audience
Do you need a population estimate ("What percent?") or directional learning ("What issues exist?")? If stakeholders will treat results as population truth, you need probability sampling or very careful caveats.
Audit your sampling frame
If you cannot list the population (or a close proxy), probability sampling may be impossible. Consider clusters (if you can list clusters) or a transparent non-probability approach.
Identify must-report subgroups
If you must report by region/role/plan type, build that into the design via stratified sampling or quotas (and plan sample size accordingly).
Match method to constraints
Time, budget, contactability, language access, and incentive policy often decide what is feasible. Document these constraints in your sampling plan.
- Choose probability methods when: You need generalizable estimates, trend tracking, or defensible comparisons over time.
- Choose non-probability methods when: You are exploring, building hypotheses, doing qualitative discovery, or you cannot build a credible frame.
- Use stratification or quotas when: Small groups matter, response differs by group, or reporting requires stable subgroup estimates.
Common pitfalls: sampling bias, coverage gaps, and response bias
Sampling problems usually show up as systematic underrepresentation. Fixing them later is hard. The most common issues are below, along with practical mitigations.
| Issue | What it looks like | How to reduce it |
|---|---|---|
| Coverage error (frame problem) | Certain people cannot be selected (missing emails, outdated roster, offline customers). | Improve the frame; add modes (SMS, mail, in-person); supplement sources; document exclusions. |
| Selection bias (procedure problem) | "Random" selection is overridden by convenience (first-come-first-served, manager picks participants). | Automate selection; separate selection from recruitment; audit exceptions. |
| Nonresponse / response bias | Selected participants do not respond, and responders differ from nonresponders. | Improve contact strategy and survey experience; analyze response patterns. See response bias. |
| Measurement error | Even a perfect sample produces bad results because questions are unclear or leading. | Use strong question design practices; see writing survey questions tips. |
A subtle pitfall is confusing random error (sampling variability) with bias. Larger samples reduce random error, but they do not fix systematic bias from a flawed frame or differential nonresponse. The U.S. Census Bureau overview is a good starting point for this distinction (Sampling Estimation & Survey Inference).
Sample size basics (non-mathy planning that still works)
Sample size planning answers two practical questions:
- How precise do you need to be? (for example, "within plus/minus 5 points")
- How many invitations do you need to send? (based on expected response)
For deeper guidance and calculators, see our sample size basics page. Here is the planning logic most teams need.
The 6 drivers that change required sample size
- Precision (margin of error): Tighter precision requires larger n.
- Confidence level: Higher confidence requires larger n (commonly 95%).
- Outcome variability: Proportions near 50/50 need more n than outcomes near 0/100.
- Design effects: Clustering, weighting, and unequal selection can increase variance.
- Subgroups: If you must report by subgroup, plan n per subgroup (not just overall).
- Expected response rate: Invitations = required completes / response rate.
| Completed responses (n) | Approx. margin of error | How to use this |
|---|---|---|
| 100 | +/- 10 points | Quick pulse checks; avoid fine-grained subgroup reporting. |
| 400 | +/- 5 points | Common target for overall percentages in many org surveys. |
| 1,000 | +/- 3 points | More stable trends and subgroup splits (if subgroups are large enough). |
If you need 400 completes and you expect a 20% response rate, plan to invite about 2,000 people (400 / 0.20). For stratified designs, do this per stratum.
For academic protocols, it is common to justify sample size (for quantitative) or provide a rationale for the intended number and coverage of perspectives (for qualitative). The University of Bath guide summarizes this expectation concisely (Sampling in research).
Applied examples: customer and employee research
Below are two scenarios that show how sampling decisions change with the population, the frame, and the decision need.
Example 1: Customer satisfaction (transactional feedback)
In a customer satisfaction survey, your frame might be recent transactions or active accounts. Two common designs:
- Systematic sample of transactions: Every k-th completed order (good for continuous programs).
- Stratified by channel/segment: Ensure representation of store vs online, new vs returning, or plan tier.
Key pitfall: sampling only the easiest channel (for example, only email receipts) and then treating results as "all customers." That is a coverage problem, not a sample size problem.
Example 2: Employee engagement (often better as a census)
For an employee engagement survey, many organizations can survey the entire employee roster (a census) because the population is small enough and contact info is available. Sampling may still be useful when:
- Fielding time must be short (for example, a rapid pulse across a large workforce).
- You need deeper qualitative follow-ups and cannot interview everyone.
- Operational constraints prevent broad outreach (contractors, frontline staff without email).
If you do sample employees, stratify by site/role/shift to prevent "office worker overrepresentation" and consider mixed-mode outreach to reduce coverage gaps.
Sampling plan template (copy/paste)
A simple written sampling plan prevents most avoidable errors. Use this as a starting point.
- 1) Research objective: What decision will this study support, and what will be reported?
- 2) Target population: Who is in-scope and out-of-scope (include time window)?
- 3) Sampling frame: Data source(s), date pulled, known gaps, and deduping rules.
- 4) Method: SRS/systematic/stratified/cluster or non-probability approach (and why).
- 5) Sample size target: Overall completes, subgroup targets, and expected response rate (link your rationale).
- 6) Recruitment plan: Modes, reminder schedule, accessibility/language plan, incentive policy.
- 7) Monitoring: What will you track during fielding (response by stratum, drop-offs, item nonresponse)?
- 8) Analysis notes: Any planned weighting, design effects, or limitations you will disclose.
After you finalize the sample plan, ensure your instrument will measure what you need. Poor question design can invalidate a great sample. If you need a quick next step, browse survey question examples and question types before fielding.
References
- Office of Research Integrity (ORI), U.S. Department of Health & Human Services. (n.d.). Elements of Research: Sampling.
- University of Bath. (n.d.). Sampling in research.
- Spolarich, A. E. (2023). Sampling Methods: A Guide for Researchers. Journal of Dental Hygiene, 97(4), 73-77.
- Elfil, M., & Negida, A. (2017). Sampling Methods in Clinical Research; an Educational Review. Emergency (Tehran), 5(1), e52.
- UK Government. (2020). A guide to inclusive social research practices. GOV.UK.
- U.S. Census Bureau. (2023). Sampling Estimation & Survey Inference.
Frequently Asked Questions
What is the difference between a population and a sample?
The population is the full group you want to describe. A sample is the subset you actually measure. Sampling is the process used to select that subset.
Is random sampling the same as random assignment?
No. Random sampling is about how you select participants from a population. Random assignment is about how you assign selected participants to conditions in an experiment. You can have one without the other.
Which sampling method is best?
The best method is the one that matches your goal and constraints. If you need defensible population estimates, use probability sampling (often stratified). If you are exploring or doing qualitative work, purposive or quota approaches may be more practical, but be clear about limitations.
What is the difference between stratified and cluster sampling?
Stratified sampling splits the population into groups (strata) and samples within every stratum to improve representation and subgroup precision. Cluster sampling samples some groups (clusters) and then samples within those clusters to reduce field cost when you cannot list individuals.
How do I know if my sample is biased?
Compare your achieved sample to known population benchmarks (from your roster, CRM, or administrative data) on key variables. Large differences can signal coverage gaps, selection issues, or nonresponse patterns. Also track differences across recruitment channels and reminder waves.
What sample size do I need for a survey?
It depends on the precision you need, subgroup reporting requirements, the design (simple vs clustered/weighted), and expected response rate. As a rough reference for overall percentages, n around 400 often yields about +/- 5 points at 95% confidence for a simple random sample (worst case). Then inflate invites to account for nonresponse.