
Key Takeaways
- Use consistent, fully labeled response options: Pick one scale (often 5 points) and keep the same labels across a section to reduce noise.
- Write statements about one idea: Avoid double-barreled items (two topics in one) and add a timeframe when it matters (e.g., "in the last 30 days").
- Choose odd vs even on purpose: Include a midpoint when neutrality is meaningful; use an even scale when you truly need a lean (and offer "Not applicable" separately).
- Report distributions, not just averages: Summarize with frequencies, top-2/bottom-2 box, and a 100% stacked bar for quick stakeholder reading.
- For multi-item constructs, build an index carefully: Use multiple related items, keep direction consistent (reverse-code if needed), and check internal consistency before using a single score.
What a Likert scale is (and what it is not)
A Likert scale is a set of ordered response options used to measure an attitude, perception, or experience (for example: Strongly disagree to Strongly agree). In practice, people also say "Likert question" to mean a single statement with those ordered options.
A single statement is commonly called a Likert item. A set of related items intended to measure one construct (e.g., "manager support") is a Likert scale in the psychometric sense. Using multiple items is one way to improve measurement quality when you care about a concept more than any single question can capture. For an overview of modern Likert scale development practices, see Jebb et al. (2021) Frontiers in Psychology.
What a Likert scale is not:
- Not every "1 to 5" rating is Likert. A 1-10 "How likely are you" scale is a rating scale, but it is not always a Likert format. If you are deciding between formats, see rating scale vs Likert scale.
- Not a substitute for open-text. Likert gives you "how much"; it usually does not give you "why". Pair key items with a short open-ended question when you need context.
Ready-to-use Likert response options (3, 4, 5, and 7 points)
Most mistakes happen in the answer choices, not the statement. Start by choosing a response set you can reuse across a page (or a whole section) of the survey.
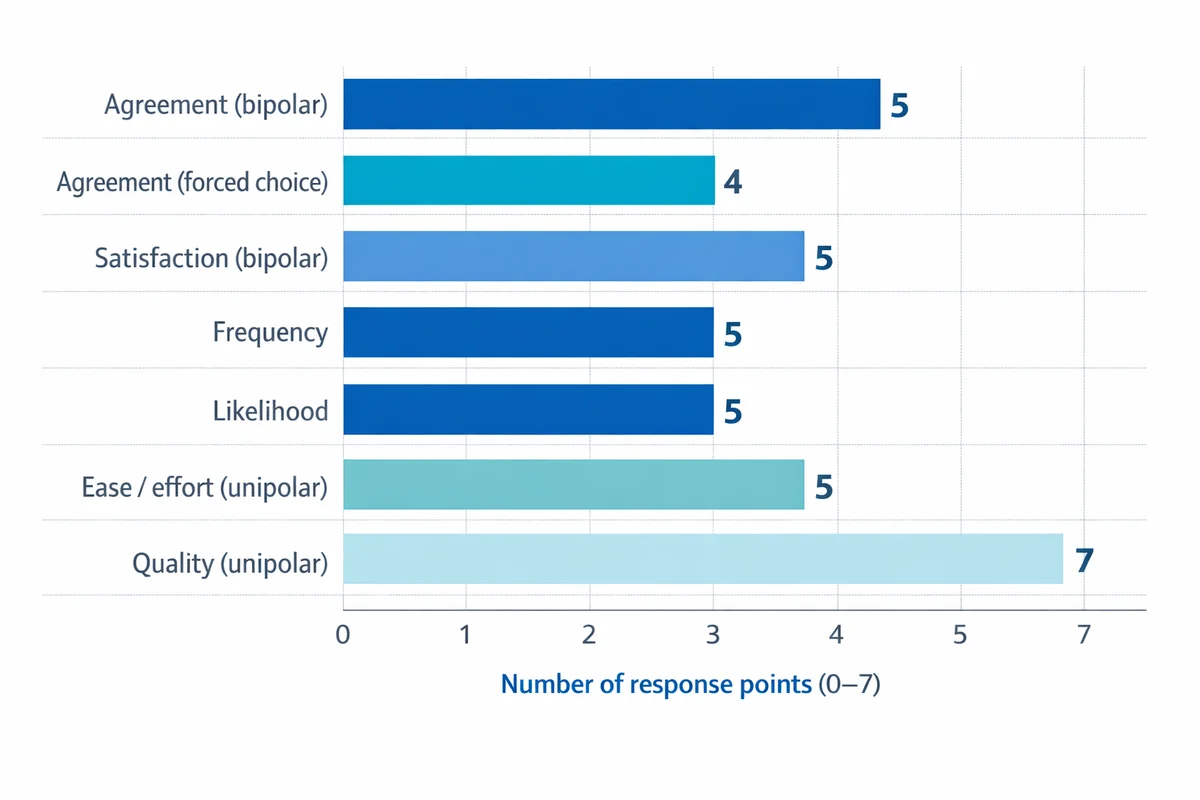
| Scale type | Points | Response options (copy-ready) | Best for | Watch-outs |
|---|---|---|---|---|
| Agreement (bipolar) | 5 | Strongly disagree; Disagree; Neither agree nor disagree; Agree; Strongly agree | Attitudes and evaluations of statements | Can invite acquiescence ("agree" tendency) if overused |
| Agreement (forced choice) | 4 | Strongly disagree; Disagree; Agree; Strongly agree | When you need a lean and neutrality is not meaningful | Do not use to "ban" uncertainty; offer "Not sure" when uncertainty is real |
| Satisfaction (bipolar) | 5 | Very dissatisfied; Dissatisfied; Neither satisfied nor dissatisfied; Satisfied; Very satisfied | customer satisfaction surveys and service evaluations | Midpoint can become a "dumping ground" if your question is vague |
| Frequency | 5 | Never; Rarely; Sometimes; Often; Always | Behaviors and recurring experiences | Define the timeframe (e.g., "in the last 4 weeks") |
| Likelihood | 5 | Very unlikely; Unlikely; Neither likely nor unlikely; Likely; Very likely | Intent to do something | Intent is not action; interpret carefully |
| Ease / effort (unipolar) | 5 | Very difficult; Difficult; Neither easy nor difficult; Easy; Very easy | Usability and process friction | Be consistent: do not mix with "satisfaction" in the same battery |
| Quality (unipolar) | 7 | Extremely poor; Very poor; Poor; Fair; Good; Very good; Excellent | When you need more sensitivity than a 5-point scale | More points can increase cognitive load for some audiences |
If you want more pre-built label sets (including variations such as "Not at all" to "Extremely"), Marquette University provides a concise library of sample Likert scales Marquette University's library of Likert scale response anchors.
"Not applicable" is not part of the ordered continuum. If you need it, add it as a distinct choice (often shown separately) so it does not distort the distribution of your ordered responses.
Likert scale question examples you can copy (by use case)
Below are statement-and-scale pairs you can paste directly into a survey. Keep your scales consistent within a section: if you use a 5-point satisfaction scale for three items, do not switch the labels on the fourth item.
Customer experience (CX) and service
For more CX measurement ideas, see our guide to CSAT survey questions.
| Measure | Question (copy-ready) | Recommended response options |
|---|---|---|
| Overall satisfaction | Overall, I am satisfied with my experience with [Company] today. | Very dissatisfied; Dissatisfied; Neither satisfied nor dissatisfied; Satisfied; Very satisfied |
| Issue resolution | The support team resolved my issue during this interaction. | Strongly disagree; Disagree; Neither agree nor disagree; Agree; Strongly agree |
| Effort | It was easy to get the help I needed. | Very difficult; Difficult; Neither easy nor difficult; Easy; Very easy |
| Clarity | The next steps were explained clearly. | Strongly disagree; Disagree; Neither agree nor disagree; Agree; Strongly agree |
| Staff professionalism | The staff member treated me with respect. | Strongly disagree; Disagree; Neither agree nor disagree; Agree; Strongly agree |
| Timeliness | I received help within a reasonable amount of time. | Strongly disagree; Disagree; Neither agree nor disagree; Agree; Strongly agree |
| Service consistency | The service I received matched what was promised. | Strongly disagree; Disagree; Neither agree nor disagree; Agree; Strongly agree |
Optional follow-up (recommended for key items):
- Open text: "What is the main reason for your rating?" (See tips for open-ended questions.)
Employee engagement and workplace climate
If you are building a pulse or annual survey, start with our employee engagement survey question bank.
| Measure | Question (copy-ready) | Recommended response options |
|---|---|---|
| Role clarity | I understand what is expected of me in my role. | Strongly disagree; Disagree; Neither agree nor disagree; Agree; Strongly agree |
| Manager support | My manager supports me in doing my best work. | Strongly disagree; Disagree; Neither agree nor disagree; Agree; Strongly agree |
| Recognition | I receive recognition when I do good work. | Strongly disagree; Disagree; Neither agree nor disagree; Agree; Strongly agree |
| Psychological safety | I can speak up about problems without negative consequences. | Strongly disagree; Disagree; Neither agree nor disagree; Agree; Strongly agree |
| Belonging | I feel like I belong on my team. | Strongly disagree; Disagree; Neither agree nor disagree; Agree; Strongly agree |
| Workload sustainability | My workload is manageable. | Strongly disagree; Disagree; Neither agree nor disagree; Agree; Strongly agree |
| Intent to stay | I see myself working here in 12 months. | Very unlikely; Unlikely; Neither likely nor unlikely; Likely; Very likely |
Product feedback and UX
For broader guidance, see our product feedback survey resources.
| Measure | Question (copy-ready) | Recommended response options |
|---|---|---|
| Usability | It is easy to complete [core task] in the product. | Strongly disagree; Disagree; Neither agree nor disagree; Agree; Strongly agree |
| Reliability | The product works reliably without errors. | Strongly disagree; Disagree; Neither agree nor disagree; Agree; Strongly agree |
| Performance | The product is fast enough for my work. | Strongly disagree; Disagree; Neither agree nor disagree; Agree; Strongly agree |
| Value | The product provides good value for the price. | Strongly disagree; Disagree; Neither agree nor disagree; Agree; Strongly agree |
| Feature satisfaction | How satisfied are you with [feature name]? | Very dissatisfied; Dissatisfied; Neither satisfied nor dissatisfied; Satisfied; Very satisfied |
| Onboarding | Getting started with the product was straightforward. | Strongly disagree; Disagree; Neither agree nor disagree; Agree; Strongly agree |
Training, learning, and internal enablement
- Relevance: "The training content was relevant to my job." (Strongly disagree to Strongly agree)
- Pace: "The pace of the training was appropriate." (Strongly disagree to Strongly agree)
- Confidence: "After this training, I feel confident applying what I learned." (Strongly disagree to Strongly agree)
- Materials quality: "The training materials were clear and easy to follow." (Strongly disagree to Strongly agree)
- Instructor effectiveness: "The instructor explained concepts clearly." (Strongly disagree to Strongly agree)
- Likelihood to recommend (internal): "I would recommend this training to a colleague." (Very unlikely to Very likely)
Brand, marketing, and communications
- Message clarity: "This message was easy to understand." (Strongly disagree to Strongly agree)
- Credibility: "I trust information from [Brand]." (Strongly disagree to Strongly agree)
- Brand fit: "[Brand] reflects my values." (Strongly disagree to Strongly agree)
- Awareness (self-report): "Before today, I was familiar with [product/feature]." (Strongly disagree to Strongly agree) or (Not at all familiar to Extremely familiar)
- Purchase intent: "I am likely to consider [Brand] the next time I buy [category]." (Very unlikely to Very likely)
If you paste these into a draft survey, keep placeholders like [feature] and [timeframe] until you do a final pass. This prevents vague items such as "The product is easy" (easy to do what?).
How to choose the right Likert scale (5 vs 7, odd vs even, bipolar vs unipolar)
You can use Likert scales for many topics, but you will get cleaner data when you choose the format intentionally.
5-point vs 7-point
- Use 5 points when you want simplicity, faster completion, and easy reporting (top-2/bottom-2 box is intuitive).
- Use 7 points when you need more sensitivity (more spread) and your audience can reliably distinguish between options such as "slightly" vs "somewhat".
In applied settings, both are common. If you plan to use more advanced statistical modeling, read a methods-oriented discussion first; clinical and research contexts often treat Likert responses as ordinal and recommend analysis approaches that match that measurement level (see Al-Jaishi et al., 2026 BMC Medical Research Methodology).
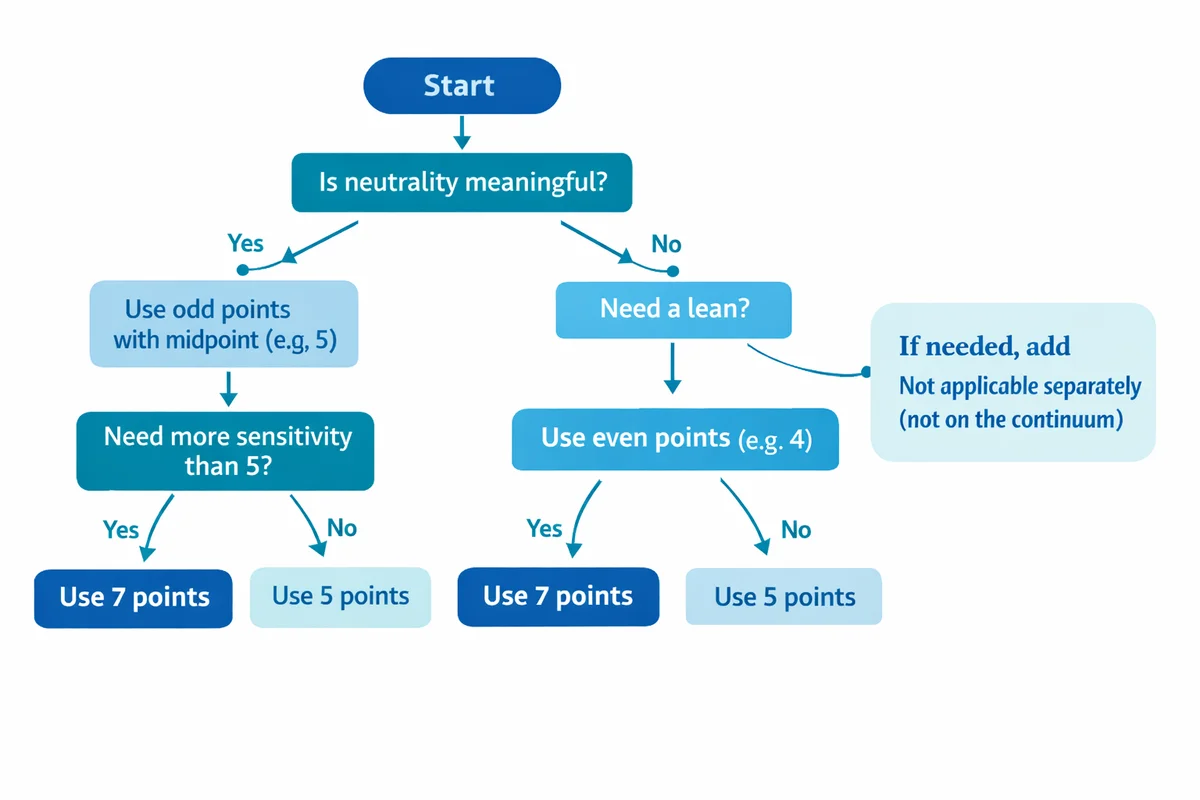
Odd vs even (include a midpoint or not)
A midpoint can mean very different things: true neutrality, lack of knowledge, mixed feelings, or "I did not read the question." If neutrality is meaningful, keep the midpoint. If you want a directional choice, remove it and consider adding a separate "Not sure" or "Not applicable" option.
Bipolar vs unipolar
- Bipolar scales span negative to positive (e.g., Very dissatisfied to Very satisfied). Use when both directions are meaningful.
- Unipolar scales span low to high of a single attribute (e.g., Not at all confident to Extremely confident). Use when "negative" is not the opposite, just the absence.
Labeling: numbers are optional, labels are not
Whenever possible, label every point (not only the endpoints). Fully labeled scales reduce interpretation differences between respondents. Numbers can help coding, but do not rely on numbers alone.
How to write strong Likert statements (with a quick checklist)
Good Likert items are boring in the best way: specific, single-topic, and easy to answer consistently. If you need a broader foundation, see our guide on how to write survey questions.
Step 1: Decide what decision the item supports
If you cannot say what you will do differently based on the result, rewrite the item or remove it.
Step 2: Make the statement observable
Replace "good" and "effective" with a concrete behavior or outcome (e.g., "My manager gives me actionable feedback" instead of "My manager is effective").
Step 3: Add a timeframe when memory matters
Examples: "in the last 30 days" for workload, "in the last 3 months" for training application.
Step 4: Match the response scale to the construct
Agreement is not always best. For behaviors, frequency is often clearer than agreement.
Step 5: Add one targeted "why" follow-up for key drivers
Use a short open-ended follow-up after 1-3 priority items, not after every item.
- One idea per item: Avoid "The app is fast and easy" (two concepts).
- No hidden comparisons: Avoid "better" unless you name what it is compared to.
- Use neutral language: Avoid emotionally loaded terms like "always" unless the scale is frequency-based.
- Keep direction consistent: If "higher is better" on one item, keep it that way for the whole battery.
- Do a 5-person read-aloud test: Ask people to explain what each option means to them before launching.
Common Likert scale biases and pitfalls (and how to reduce them)
Likert questions are easy to answer, which is why they are easy to answer poorly. Many issues fall under response bias -- consistent patterns in responding that are not driven by the true opinion.
Acquiescence ("yea-saying")
People tend to agree with statements, especially when they are vague or socially desirable.
- Reduce it: Use more behavioral items, not only attitude statements. Consider mixing formats (frequency, satisfaction) rather than all agreement.
- Do not "fix" it with lots of negative wording: Negatively worded items can confuse respondents. If you include one, make it simple and test it.
Central tendency (overusing the middle)
Respondents sometimes choose the midpoint to avoid thinking, avoid risk, or because the item is unclear.
- Reduce it: Tighten the wording, define the timeframe, and ensure the item is applicable. Use "Not applicable" instead of forcing a midpoint.
Extreme responding (always choosing endpoints)
Some respondents prefer extremes, while others avoid them. This can differ by individual and context.
- Reduce it: Provide clear labels for every point (not just endpoints) and keep the scale consistent.
Order effects and straightlining
Long grids can lead to straightlining (same answer repeatedly) or fatigue.
- Reduce it: Keep batteries short, group truly related items, and consider splitting into pages. If your tool allows, randomize item order within a block (when it does not harm comprehension).
How to summarize Likert results (with a real walkthrough)
Before you do anything fancy, produce a clean distribution. This is the fastest way to spot polarized results (lots of Strongly disagree and Strongly agree) and the easiest way to explain findings to stakeholders. For more fundamentals, see analyzing survey data.
Example item: "It was easy to get the help I needed." (5-point ease scale: Very difficult; Difficult; Neither; Easy; Very easy)
| Response option | Count | Percent | Bucket (optional) |
|---|---|---|---|
| Very difficult | 18 | 9% | Bottom-2 |
| Difficult | 32 | 16% | Bottom-2 |
| Neither easy nor difficult | 54 | 27% | Middle |
| Easy | 66 | 33% | Top-2 |
| Very easy | 30 | 15% | Top-2 |
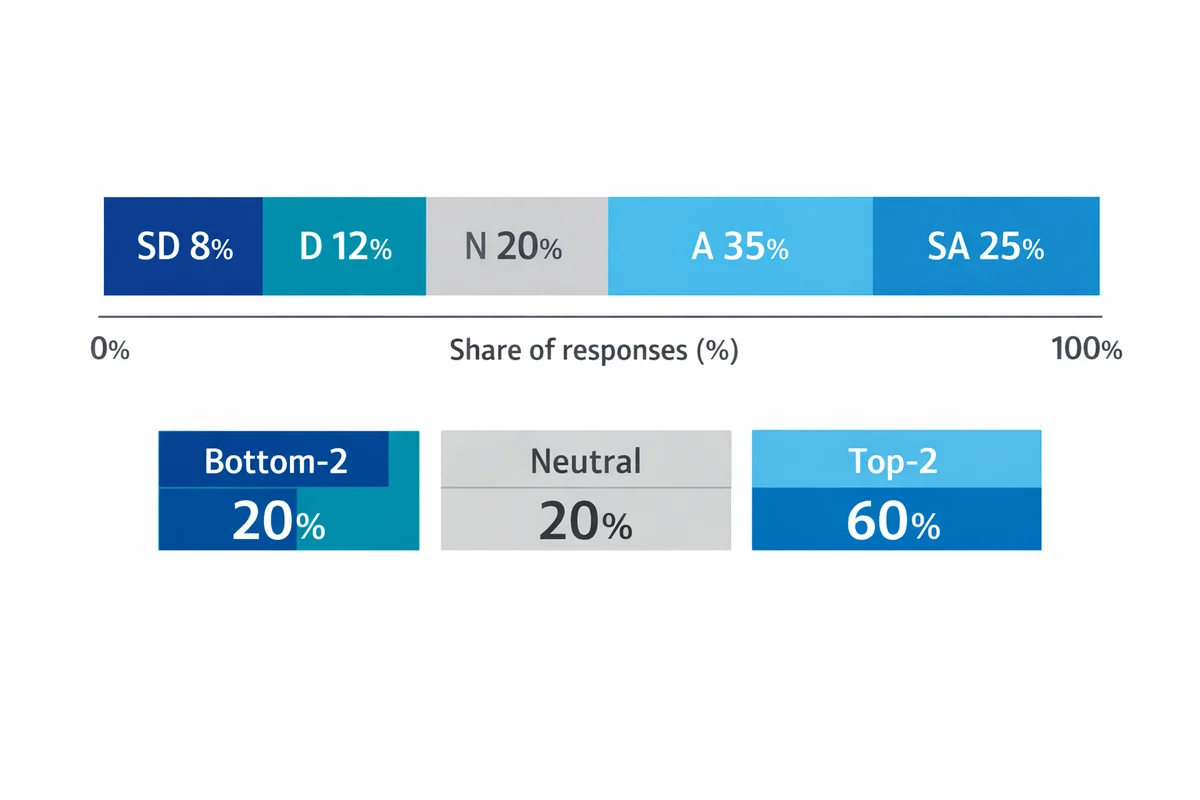
What to report (practical defaults)
- Top-2 box: Easy + Very easy = 48%
- Bottom-2 box: Difficult + Very difficult = 25%
- Midpoint share: Neither = 27% (often a signal to investigate)
- Mode: Easy (the most common response)
If you need a single directional summary, a simple and explainable option is:
- Net (Top-2 minus Bottom-2): 48% - 25% = +23 points
For stakeholder reporting, a 100% stacked bar chart works well: put negative responses to the left, positive to the right, and the midpoint in the center. The shape quickly communicates improvement or decline over time. Many competitors mention bar charts; few explain how to structure them for Likert.
Should you calculate the mean?
Likert responses are ordered categories (ordinal). Many teams still compute means for convenience, but that can imply equal distances between options. Methods guidance for Likert-type ordinal scales generally recommends approaches that respect ordinality (e.g., distributions, medians/modes, ordinal models), especially in high-stakes settings (see Al-Jaishi et al., 2026 BMC Medical Research Methodology). If you do compute averages for internal tracking, treat them as a descriptive shorthand and keep the full distribution in your reporting deck.
For additional perspective on when parametric methods are used (and what assumptions are involved), see Huh and Gim (2025) BMC Medical Research Methodology.
How to compare groups or time periods
When comparing (for example) Region A vs Region B, keep it simple:
- Show two 100% stacked bars side-by-side.
- Also show Top-2 and Bottom-2 box percentages.
- Call out the largest movements (e.g., "Top-2 increased by 9 points quarter-over-quarter").
Using multiple Likert items: building an index you can trust
For big concepts (engagement, trust, usability), a single item is rarely enough. A short battery of related items usually gives more stable results. Modern guidance on Likert scale development emphasizes careful item design, content coverage, and validation over simply adding more questions (Jebb et al., 2021 Frontiers in Psychology).
A practical way to build a mini-index (without overcomplicating it)
Pick 3-6 items that truly belong together
Example: "My manager sets clear priorities", "My manager supports my development", "My manager gives useful feedback".
Keep response options identical
Same labels, same order, same direction.
Avoid mixing positive and negative wording unless you have a reason
If you include a negatively worded item (e.g., "Priorities change without explanation"), ensure you reverse-code it before combining.
Check internal consistency before combining
A common check is Cronbach's alpha. Treat it as a diagnostic, not a trophy: if one item does not correlate with the rest, it may be measuring something else.
Report both the index and the item-level breakdown
The index is a summary; the items tell you what to fix.
When to use something other than a Likert scale
Likert is not the answer to every measurement problem. Consider alternatives when:
- You need tradeoffs, not ratings: If everything gets rated "important", you may need a prioritization method (e.g., best-worst scaling). A research comparison of best-worst scaling vs Likert in an attributes context is discussed by Heo et al. (2022) Journal of Business Research.
- You need a single overall score with a known benchmark: Sometimes a dedicated metric (CSAT, CES, NPS) or a single rating scale question is easier to interpret and trend.
- You need rich diagnostics: Use fewer Likert items and more targeted follow-ups (including open text follow-ups).
Next steps: turn these examples into a real survey
A quick build path that works for most teams:
- Start from a template: Choose from our survey templates and swap in the Likert items above.
- Keep sections short: 6-10 Likert items per topic is usually plenty.
- Include one action question: "What is the one change that would most improve your experience?" (open text).
- Plan reporting upfront: Decide which 3-5 charts you will show (stacked bars, top-2 box trends, and key driver items).
Frequently Asked Questions
Should I use a 5-point or 7-point Likert scale?
Use 5 points for simplicity and faster completion. Use 7 points when you need more sensitivity and your audience can reliably distinguish between adjacent options. Whichever you pick, keep it consistent within a section.
Is it okay to remove the neutral option?
Yes, if neutrality is not meaningful for your decision and you are comfortable forcing a lean. If respondents may genuinely be unsure or the item may not apply, add separate options like "Not sure" or "Not applicable" rather than forcing a directional response.
Can I average Likert responses?
You can compute an average as a rough descriptive shortcut, but it assumes equal spacing between response options. For reporting and decisions, distributions (percent by category), top-2/bottom-2 box, and the mode are usually easier to defend and explain. For methodological guidance in clinical and research contexts, see Al-Jaishi et al. (2026) in BMC Medical Research Methodology.
Should I label every point or only the endpoints?
Label every point when you can. Fully labeled options reduce differences in how people interpret the unlabeled middle points, which can improve comparability across respondents.
What is the difference between a Likert scale and a rating scale?
A Likert scale uses ordered, labeled categories to measure a specific attitude or evaluation (often agreement, satisfaction, frequency, etc.). A rating scale is broader and can include numeric-only scales (like 0-10) or other formats. See rating scale questions for examples.
How many Likert questions should I ask?
Ask the minimum needed to support decisions. As a practical starting point: 6-10 items per topic (CX, engagement, product usability), plus 1-2 open-text follow-ups for key drivers. If you need a reliable construct score, use multiple related items rather than one broad item.
References
- Jebb, A. T., Ng, V., & Tay, L. (2021). A review of key Likert scale development advances: 1995-2019. Frontiers in Psychology, 12, 637547. https://doi.org/10.3389/fpsyg.2021.637547
- Marquette University, Division of Student Affairs. (n.d.). Sample Likert Scales. Marquette University. Retrieved March 2, 2026, from https://www.marquette.edu/student-affairs/assessment-likert-scales.php
- Heo, C. Y., Kim, B., Park, K., & Back, R. M. (2022). A comparison of best-worst scaling and Likert scale methods on peer-to-peer accommodation attributes. Journal of Business Research, 148, 368-377. https://doi.org/10.1016/j.jbusres.2022.04.064
- Al-Jaishi, A. A., Cuerden, M. S., Luo, B., et al. (2026). Statistical analysis of Likert-based ordinal scales: A guide for clinical trialists. BMC Medical Research Methodology. https://doi.org/10.1186/s12874-026-02793-5
- Huh, I., & Gim, J. (2025). Exploration of Likert scale in terms of continuous variable with parametric statistical methods. BMC Medical Research Methodology, 25, 218. https://doi.org/10.1186/s12874-025-02668-1