
Key Takeaways
- Ask only what you will use: Start with a short core set (age range, location, gender if needed, education, and role) and add sensitive items only when they change decisions.
- Make sensitive demographics optional: For items like income, disability, religion, or sexual orientation, include "Prefer not to say" and explain why you are asking to reduce drop-off and bias.
- Use non-overlapping response options: Especially for age and income bands; follow answer option design basics so every respondent can find exactly one fit.
- Place demographics strategically: Put them at the end by default, but move a question earlier when it powers branching/quotas or prevents irrelevant questions (see survey design best practices).
- Plan the analysis upfront: Decide which outcomes you will cross-tab by demographic groups, confirm you have enough responses per segment (sample size planning), and report results with filters and crosstabs (survey dashboards).
What demographic survey questions are (and what they are not)
Demographic survey questions collect characteristics about respondents so you can describe your sample, segment results, and check whether responses differ across groups. The answers are demographic information (often called a demographics definition in research and reporting) like age, education, or location.
Demographics are not "opinions" questions. They are descriptive variables you use to:
- Verify who responded (sample composition and representativeness)
- Filter or break results into segments (e.g., satisfaction by tenure)
- Build practical segments for action (not stereotypes)
If you cannot explain how a demographic answer will be used (in plain language), do not ask it. This reduces drop-off and helps avoid collecting sensitive data you do not need.
Choose your minimum set (then add only what you need)
Before you copy-paste a full block of demographic questions, decide what analysis you will run. This is the fastest way to keep the survey short and reduce response bias from sensitive or time-consuming items.
A practical approach is to define:
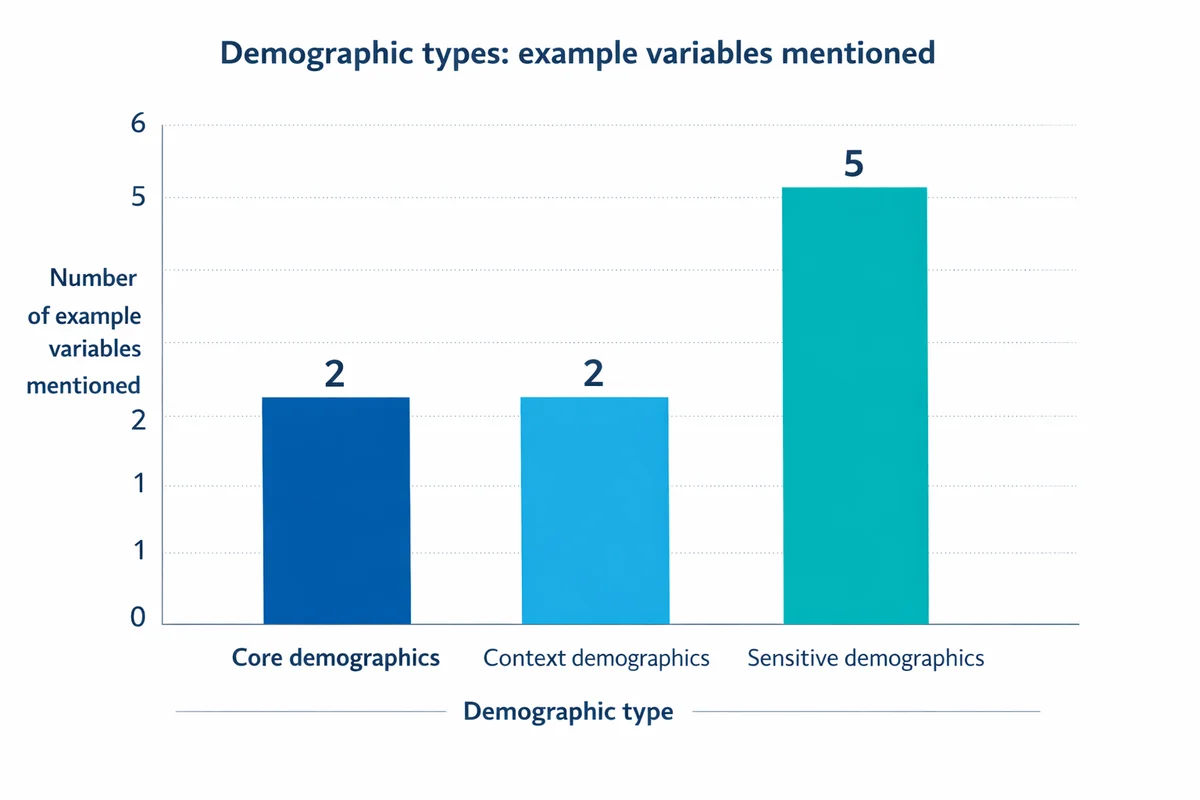
- Core demographics: Needed to describe your audience (often age range and geography) or to compare to a known population (customer base, employee roster, community).
- Context demographics: Directly related to your survey topic (e.g., role for an employee IT survey; tenure for a training survey).
- Sensitive demographics: Higher-risk items (income, disability, religion, political affiliation, sexual orientation). Only include if necessary, keep optional, and support with privacy language.
If your goal includes generalizing to a wider group, align your demographic plan with sampling basics (how you recruited) so you can judge how representative your final respondents are.
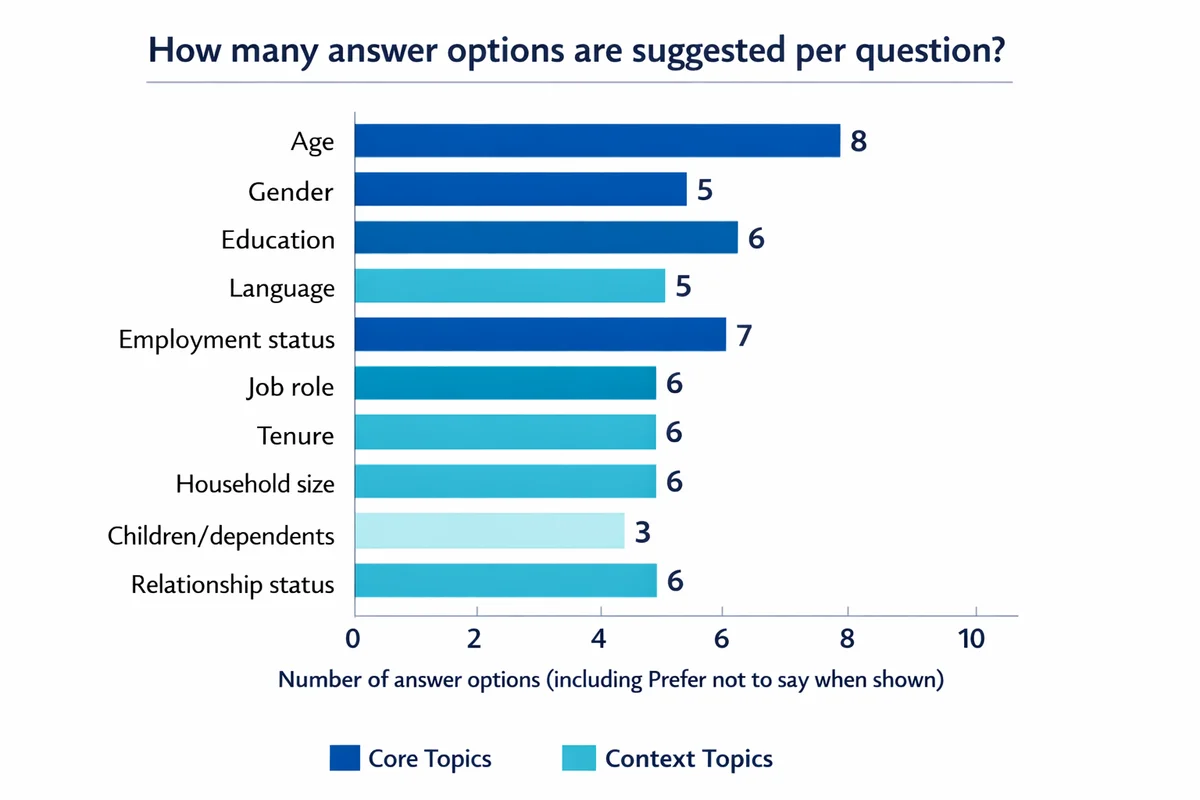
Copy-ready demographic question bank (with answer options)
Use the examples below as a starting point. Adapt labels and categories to your context and geography, and follow question wording guidelines to keep terms unambiguous.
Core demographics (most surveys)
| Topic | Copy-ready question | Suggested answer options | Notes |
|---|---|---|---|
| Age | What is your age? | Best practice: Use age ranges unless you truly need exact age. Under 18 |
Ensure ranges do not overlap and cover all plausible ages (see how to write response choices). |
| Location | Where do you currently live? | Country (drop-down) OR Prefer not to say |
Collect the least-granular location that still supports your analysis (city/ZIP can become identifying in small samples). |
| Gender (if needed) | What is your gender? | Woman Man Non-binary Another gender (please specify): ____ Prefer not to say |
Only include when it will be analyzed. Make it optional in most customer surveys. |
| Education | What is the highest level of education you have completed? | Less than high school High school diploma or equivalent Some college/associate degree Bachelor's degree Graduate or professional degree Prefer not to say |
Keep categories broad unless your analysis needs detail. |
| Race/ethnicity (if needed) | Which race(s) or ethnic group(s) do you identify with? (Select all that apply) | Multi-select list adapted to your country/region, plus: Another group (please specify): ____ |
Use "select all" for multi-identity responses. Avoid forcing a single choice unless required. |
| Language | What language do you prefer for communications or support? | English Spanish French Other (please specify): ____ Prefer not to say |
Useful when you will offer follow-up in the stated language. |
Work, role, and household context (include when relevant)
| Topic | Copy-ready question | Suggested answer options | Notes |
|---|---|---|---|
| Employment status | Which of the following best describes your current employment status? | Employed full-time Employed part-time Self-employed Student Not currently employed Retired Prefer not to say |
Choose categories that match your audience (e.g., omit "Student" in a B2B sample). |
| Job role (employees) | Which best describes your primary role? | Individual contributor People manager Director/VP Executive/C-level Other (please specify): ____ Prefer not to say |
Role is often more actionable than department names, and less identifying. |
| Tenure (employees/customers) | How long have you been with [Company/Product/Program]? | Less than 3 months 3-11 months 1-2 years 3-5 years 6+ years Prefer not to say |
Tenure is a high-signal segment for satisfaction and onboarding issues. |
| Household size | How many people live in your household (including you)? | 1 2 3 4 5+ Prefer not to say |
Use broad buckets unless you need precision for eligibility. |
| Children/dependents | Do you have any children or other dependents you care for? | Yes No Prefer not to say |
Consider adding a follow-up only if "Yes": number/age bands (via skip logic). |
| Marital/relationship status | Which best describes your current relationship status? | Single In a relationship/partnered Married Separated/divorced Widowed Prefer not to say |
Use only when relevant (e.g., household decision-making studies). |
Sensitive demographics (optional in most surveys)
| Topic | Copy-ready question | Suggested answer options | Notes |
|---|---|---|---|
| Income (household) | What is your approximate annual household income (before taxes)? | Under $25,000 $25,000-$49,999 $50,000-$74,999 $75,000-$99,999 $100,000-$149,999 $150,000+ Prefer not to say |
Localize currency and bands. Make optional. Avoid "exact income" unless necessary. |
| Disability status | Do you identify as a person with a disability? | Yes No Prefer not to say |
If your goal is accessibility improvement, consider a follow-up: "Which types of barriers affect you most?" (multi-select) without requiring medical detail. |
| Veteran status | Are you a veteran of the armed forces? | Yes No Prefer not to say |
Include only when it informs eligibility, services, or equity reporting. |
| Religion | What is your religion or belief system, if any? | Provide region-appropriate categories, plus: No religion |
High sensitivity. Ask only with a clear reason and strong privacy language. |
| Political affiliation | Which of the following best describes your political affiliation? | Option list tailored to your country/region Independent/none Prefer not to say |
Also high sensitivity; expect higher nonresponse and potential social desirability effects. |
| Sexual orientation | Which of the following best describes your sexual orientation? | Heterosexual/straight Gay or lesbian Bisexual Another orientation (please specify): ____ Prefer not to say |
Ask only when it changes analysis or improves inclusion. Keep optional. |
Inclusive answer options: practical patterns that work
Inclusivity is mostly about three things: (1) respondents can find themselves in the options, (2) you do not force disclosure, and (3) your categories match how you will analyze and report. Consider all before adding questions to our free survey maker
Use these three building blocks
- Add "Prefer not to say" when the topic is sensitive: It reduces item nonresponse turning into survey abandonment, and it makes your missingness explicit for analysis.
- Offer "Another (please specify)" when categories cannot be exhaustive: Keep it optional and do not make respondents write an essay.
- Choose single-select vs. multi-select intentionally: Use multi-select for identities that can be multiple (race/ethnicity, languages). Use single-select when you need mutually exclusive analysis buckets.
Avoid these common option problems
- Overlapping ranges: e.g., "18-25" and "25-34" creates ambiguity at 25.
- Uneven specificity: e.g., listing one detailed group and lumping everyone else into "Other" can feel dismissive.
- Hidden assumptions: e.g., asking "What is your husband/wife's income?" assumes marital status and a binary structure.
If you want a deeper refresher on response choice construction, start with multiple-choice questions guidance and then apply it to demographic categories.
Placement, skip logic, and optionality (so demographics do not tank completion)
Demographic questions can feel personal, especially when they appear before respondents trust you. A randomized experiment found that the inclusion and placement of demographic items can affect response behavior and measurement in some contexts, which is why placement and optionality should be deliberate rather than habitual (Ziegenfuss et al., 2021).
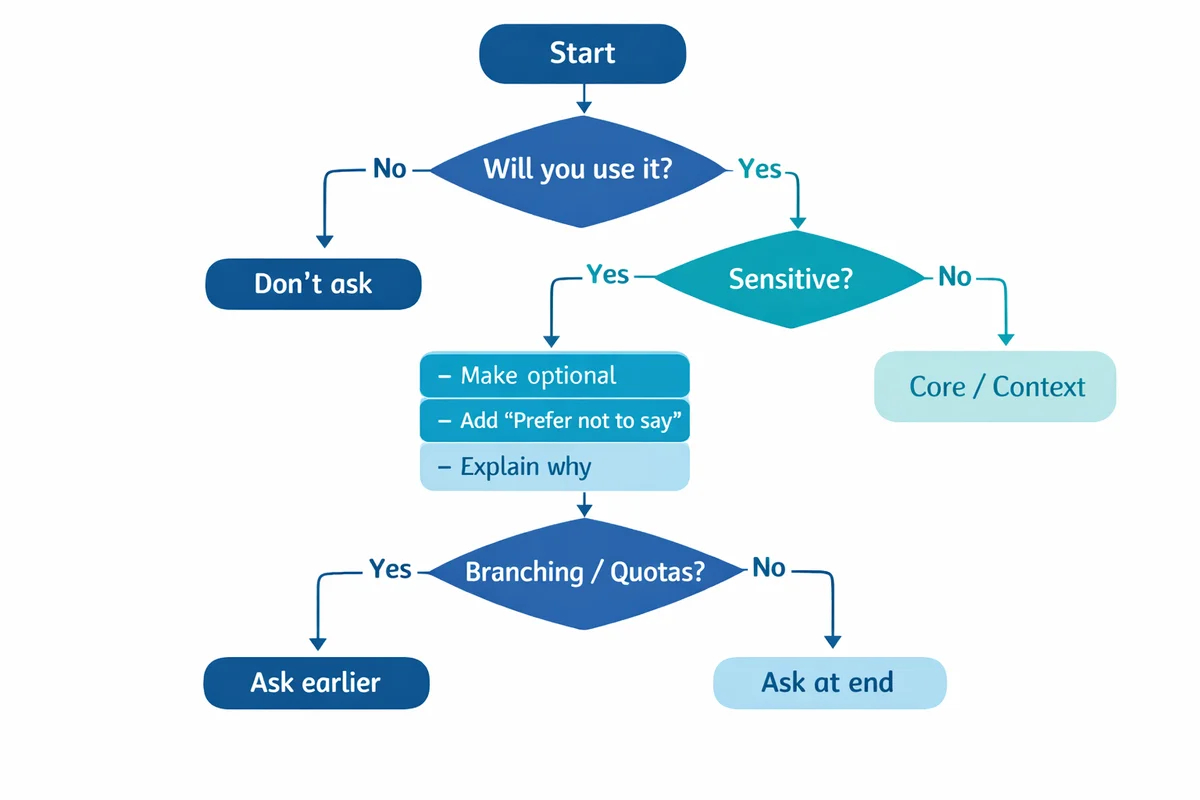
Step 1: Decide whether each demographic is required
Default to optional for sensitive items (income, disability, religion, political affiliation, sexual orientation). Required demographics are most defensible when they drive eligibility, quotas, or essential subgroup reporting.
Step 2: Put most demographics at the end
End placement reduces early drop-off. The exception is when a demographic answer is needed to route respondents using skip logic (branching) or to prevent irrelevant questions. This is part of question order and flow.
Step 3: Use branching to limit sensitive follow-ups
Example: Ask "Do you have dependents?" then show a follow-up only for "Yes." Keep follow-ups short and purpose-driven.
Step 4: Reduce ambiguity in wording
Define timeframes and concepts (e.g., "annual household income before taxes"). Apply writing clear survey questions practices: simple language, one idea per question, and consistent terms.
Privacy, consent, and handling sensitive demographics
Demographic data becomes sensitive quickly when it can identify someone (directly or indirectly). Protecting respondents is both an ethical requirement and a data-quality issue: when people feel unsafe, they skip items or abandon the survey.
For studies involving human subjects or regulated contexts, institutional guidance often recommends collecting only what is necessary, explaining purpose, and describing how data will be stored and used (Lehigh University Office of Research Integrity, 2022).
Copy-ready privacy microcopy (edit to fit your context)
"The next questions help us understand whether experiences differ across groups. These questions are optional. Your answers will be reported in aggregate and used only for analysis."
Data handling checklist
- Choose anonymity vs. confidentiality: If you can avoid collecting identifying data, do so. If you must link responses (confidential), restrict access and document who can see what.
- Limit granularity in small samples: Detailed location, rare roles, or niche identity categories can re-identify people when combined.
- State retention and deletion rules: How long will you keep raw data? When will you delete it? Align with your survey privacy policy.
- Predefine reporting thresholds: For example, do not display subgroup results when n < 5 (or your chosen threshold) to reduce re-identification risk.
If you are designing an instrument for a formal program or official reporting, it is worth reviewing quality guidance for developing collection instruments and supporting materials (U.S. Census Bureau, 2021).
After the survey: how to use demographic data (without over-interpreting it)
Demographics are most valuable when they change decisions. Here is a lightweight workflow you can run in any spreadsheet or analytics tool (and then automate in reporting and visualization dashboards).
1) Check representativeness (who answered?)
Start with frequency tables: percent by age range, region, tenure, role, etc. Compare those distributions to your known population (customer list, employee roster, member database) where possible. This is where your representative samples plan either holds up or shows gaps.
If you see skew (e.g., new customers over-represented), document it and consider targeted follow-ups or weighting. Do not hide it.
2) Cross-tab demographics with your key outcomes
Pick 1-3 outcomes (e.g., overall satisfaction, likelihood to recommend, task success). Then run crosstabs by the demographics you actually care about. A simple pattern:
- Rows: demographic groups (e.g., tenure buckets)
- Columns: outcome response categories or the mean score
- Add: group n and missingness ("Prefer not to say")
When differences appear, sanity-check sample size per group. Small segments can swing wildly; if subgroup comparisons matter, plan for it in advance with how many responses you need.
For deeper interpretation and cleaning steps (recoding open-text "Other" responses, handling missingness), use analyzing survey data guidance.
3) Turn demographics into usable segments
Segments should be actionable: groups you can serve differently, not labels for their own sake. Combine demographic and behavioral variables when possible (e.g., tenure + product plan + usage pattern) to avoid simplistic conclusions.
- For go-to-market analysis, use market segmentation to connect groups to targeting and messaging decisions.
- For research-driven profiles, use buyer personas carefully: demographics can add context, but attitudes and needs should drive the persona story.
4) Report results clearly
In your dashboard or report:
- Show the demographic distributions first (who responded).
- Then show outcome comparisons with filters (e.g., satisfaction by tenure).
- Always include n per subgroup and suppress tiny groups.
Common mistakes (and quick fixes)
- Mistake: Making all demographics required. Fix: Require only what is essential; otherwise allow skip and include "Prefer not to say" to reduce nonresponse bias.
- Mistake: Collecting precise identifiers (exact age, full address) without need. Fix: Use bands and broader geography; strengthen confidentiality and anonymity language.
- Mistake: Overlapping or incomplete ranges. Fix: Audit options using answer option design rules; test edge cases (25 years old, $50,000 income).
- Mistake: Asking sensitive items early. Fix: Move them to the end unless needed for routing (see survey layout and UX).
- Mistake: Reporting subgroup results with tiny n. Fix: Set a minimum n threshold, and if needed increase recruitment or adjust power and sample size.
References
- Ziegenfuss, J. Y., Easterday, C. A., Dinh, J. M., JaKa, M. M., Kottke, T. E., & Canterbury, M. (2021). Impact of demographic survey questions on response rate and measurement: A randomized experiment. Survey Practice, 14(1).
- Lehigh University, Office of Research Integrity. (2022). Guidance: Collecting demographic information from human subjects.
- U.S. Census Bureau. (2021). Statistical Quality Standard A2: Developing data collection instruments and supporting materials.
- Relevo, R., & Paynter, R. (2012). Demographic questionnaire. In Peer Review of Search Strategies. Agency for Healthcare Research and Quality (AHRQ).
Frequently Asked Questions
Should demographic questions be required?
Usually no. Require a demographic item only when it is essential to eligibility, routing/skip logic, quotas, or mandatory reporting. For sensitive items, make them optional and include "Prefer not to say" to limit drop-off and response bias.
Where should I place demographics: start or end?
Default to the end. Place a demographic item earlier only when it prevents irrelevant questions (branching) or is needed to screen respondents. Use survey design best practices to route respondents cleanly and keep the experience short.
Do I always need a "Prefer not to say" option?
For sensitive topics, yes. For neutral items (like region in a national customer survey), it is optional. The goal is to avoid forcing disclosure while keeping missingness explicit for analysis and reporting.
How many demographic questions is too many?
More than you will use. A common pattern is 3-6 core items plus 0-3 context items. Add sensitive items only when they support a specific analysis, and keep them optional. If you plan to compare multiple subgroups, confirm you have enough responses per group using sample size planning.
Can demographic answers identify someone even without a name?
Yes. Combinations like department + location + role + tenure can re-identify people in small groups. Reduce granularity, suppress small-n reporting, and follow data privacy for surveys practices when collecting and sharing results.