
Key Takeaways
- Start with completed responses: Sample size formulas tell you how many completed surveys you need (not how many people to invite).
- The big drivers are confidence, margin of error, and variability: Population size matters much less unless you are sampling a meaningful share of a small population.
- Use p = 0.5 when unsure: For yes/no or percent questions, p = 0.5 is a conservative assumption that produces the largest required sample.
- Apply finite population correction (FPC) when n is 5-10%+ of N: If your population is small (like employees), FPC can reduce the required completes.
- Convert completes to invitations: Invites needed = required completes / expected response rate. More invites increases completes, but it does not automatically fix nonresponse bias.
Sample size, defined (and what this guide calculates)
Sample size usually means the number of completed survey responses you will analyze. This is the number that drives your margin of error (precision) at a chosen confidence level.
This article shows you how to determine that number using standard survey formulas, then how to translate it into how many people to invite based on your expected response rate.
If you want a faster route, start with our sample size calculator and come back here when you need to defend the assumptions.
Most sample size math gives you completed responses (n). In practice, you plan invitations so that enough people actually finish the survey.
The 4 inputs that drive sample size
For common surveys where you estimate a percentage (a proportion), your required completes depend on four inputs:
- Confidence level (often 90%, 95%, or 99%): how confident you want to be that the interval contains the true population value.
- Margin of error (E): the plus/minus precision you need (for example, +/- 5 percentage points).
- Population size (N): how many people are in the group you want to describe (customers, employees, members).
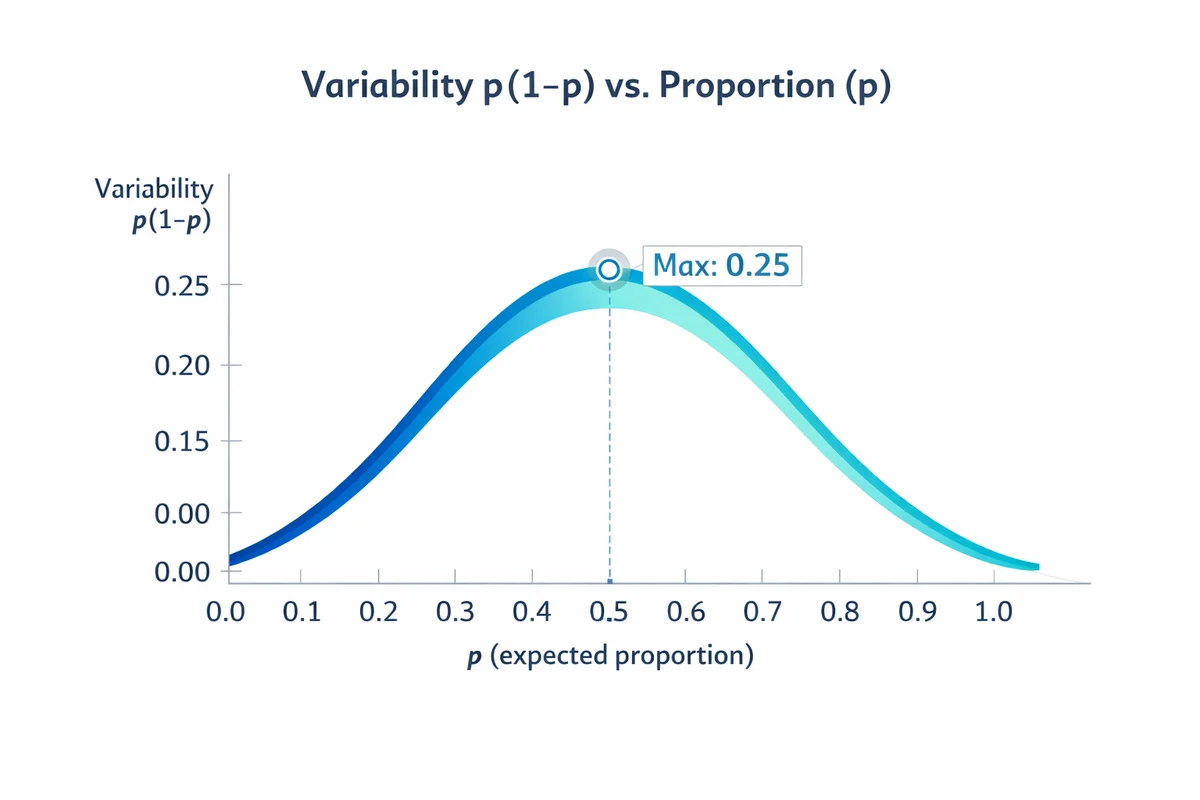
- Variability (p): your best guess of the proportion for the measure you care about (or use a conservative default).
These inputs and the standard approach are widely documented in statistical handbooks and applied survey guidance (for example, NIST and university extension materials) (NIST; Israel, 1992).
Confidence level (and how it differs from significance)
Confidence level is usually communicated as 90%/95%/99%. In hypothesis testing language, the related concept is alpha (for example, 0.05), which is why people mix up confidence and significance. If that distinction is fuzzy, see confidence level vs statistical significance before you pick a number.
Margin of error (E) is the decision variable
Pick E based on what differences you need to act on. If the business decision changes when satisfaction is 72% vs 74%, you need a tighter margin than if the decision changes only when it is 72% vs 82%.
Common planning choices for broad, top-line reporting are 5% (quick pulse) or 3% (more precise). Choosing 2% or 1% increases sample size sharply.
Population size (N) only matters when your population is small
For very large populations, required completes barely change as N increases. Population size becomes important when your required sample is a substantial share of N; that is when you use the finite population correction discussed below (NIST).
Variability (p): when you do not know it, use 0.5
For percentage questions (yes/no, choose A vs B, percent who agree), variability is driven by p(1-p). This term is largest at p = 0.5, so using p = 0.5 is a conservative assumption that yields the largest required sample when you do not have a prior estimate (Israel, 1992).
If you have past survey data, a pilot, or a benchmark study, you can use a better estimate of p to avoid over- or under-sizing. Also remember that noisy measurement increases apparent variability; better question wording can reduce noise so you can get more stable results from the same n.
Sample size formula for a proportion (most surveys)
For a proportion (percent), the standard starting point is the sample size for a large (effectively infinite) population:
n0 = (Z^2 * p * (1 - p)) / E^2
Where:
- n0 = required completed responses (before any finite population correction)
- Z = Z-score for your confidence level
- p = expected proportion (use 0.5 if unknown)
- E = margin of error as a decimal (5% -> 0.05)
This is the same basic approach presented in applied sample size guides for survey planning (Israel, 1992) and general statistical references (NIST).
| Confidence level | Z |
|---|---|
| 90% | 1.645 |
| 95% | 1.96 |
| 99% | 2.576 |
If you pick 95% confidence and p = 0.5, then n0 is about 0.9604 / E^2. That is why +/- 5% lands near 385 completes.
Worked example: required completes
Scenario: You want to estimate the percent of customers who would recommend your product. You want 95% confidence and a +/- 5% margin of error. You do not have a strong prior estimate for the percent, so you use p = 0.5.
Step 1: Choose Z, E, p
Z = 1.96 (95%); E = 0.05; p = 0.5.
Step 2: Plug into the formula
n0 = (1.96^2 * 0.5 * 0.5) / 0.05^2
n0 = (3.8416 * 0.25) / 0.0025 = 0.9604 / 0.0025 = 384.16
Step 3: Round up
Plan for 385 completed surveys.
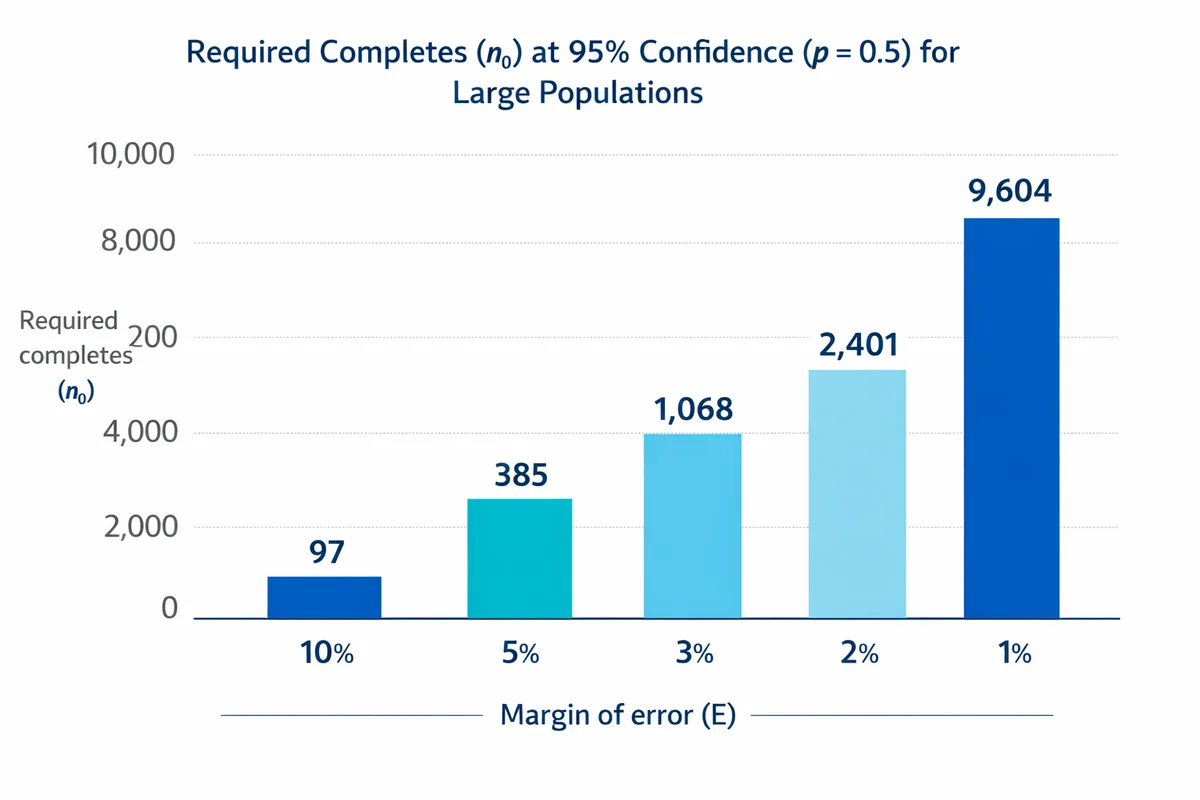
That 385 is the familiar rule-of-thumb you see in many sample size tables because it is the 95% and +/- 5% case with maximum variability (p = 0.5). If you need tighter precision, completes rise quickly:
| Margin of error (E) | Required completes (n0) | What it means |
|---|---|---|
| 10% (0.10) | 97 | Fast pulse read |
| 5% (0.05) | 385 | Common top-line reporting |
| 3% (0.03) | 1,068 | More precise tracking |
| 2% (0.02) | 2,401 | High precision |
| 1% (0.01) | 9,604 | Very high precision |
Once you have required completes, you can decide how that precision affects what you can safely conclude from your data (for example, whether small shifts are meaningful or likely noise).
Adjust for a finite population (FPC)
If your population is small enough that you are sampling a meaningful share of it, you can reduce the required completes using finite population correction (FPC). A common rule is to consider FPC when your initial n0 is 5-10% or more of N (NIST).
One common form of the adjusted sample size is:
n = n0 / (1 + ((n0 - 1) / N))
Where:
- n = required completes after finite population correction
- n0 = large-population sample size from the earlier formula
- N = population size
Worked example with FPC (employee survey)
Scenario: You have N = 1,200 employees. You want 95% confidence, +/- 5% margin of error, and you use p = 0.5.
- From the earlier example, n0 = 385.
- Apply FPC: n = 385 / (1 + (384 / 1200)) = 385 / 1.32 = 291.7
- Round up: 292 completes
Without FPC you would target 385 completes. With FPC, because your population is only 1,200, you can justify a smaller target of about 292 completes for the same confidence and margin of error.
When N is small and reachable (for example, a single department), it can be more practical to invite everyone and focus on response rate and bias controls. Sample size math still helps you set a minimum completes target.
From completes to invitations (response rate math)
Once you know how many completed responses you need, convert that into a realistic invitation count:
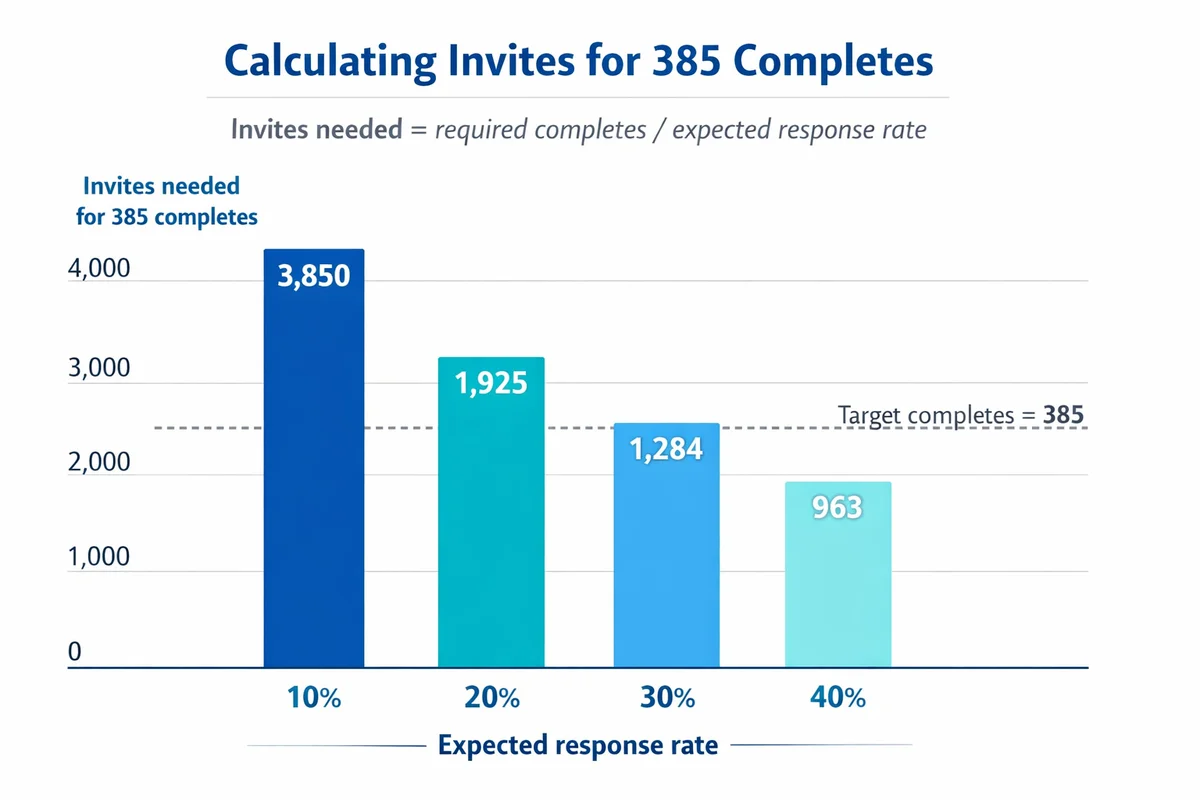
Invites needed = Required completes / Expected response rate
Use response rate as a decimal (30% -> 0.30). Always round up.
Example: 292 required completes, expected 35% response rate
If your target is 292 completed responses and you expect a 35% response rate:
Invites = 292 / 0.35 = 834.3 -> invite at least 835 people.
| Required completes | Expected response rate | Invites to plan |
|---|---|---|
| 385 | 60% | 642 |
| 385 | 30% | 1,284 |
| 385 | 15% | 2,567 |
| 292 | 50% | 584 |
| 292 | 35% | 835 |
| 292 | 20% | 1,460 |
More invites increase n, but they do not automatically fix bias
Low response rate creates two separate issues:
- Not enough completes: your margin of error is larger than planned.
- Nonresponse bias risk: responders may differ from non-responders in ways that matter.
Inviting more people mainly addresses the first issue. It does not guarantee the second issue goes away. If you want a practical explanation of the bias risk (and how it can skew results), see response bias and nonresponse bias.
How to choose an expected response rate
Use the best available evidence in your context:
- Your historical surveys: same audience, same channel, similar length.
- Operational realities: how easy it is for people to access the survey; whether you can send reminders; whether the topic is salient.
- Sampling approach: probability-based outreach often behaves differently from opt-in convenience samples. If you are unclear on the difference, review sampling methods.
When you are unsure, plan scenarios (for example 20%, 30%, 40%) and make the invitation count a controllable lever during fieldwork (send a reminder, extend the window, or expand the invite list).
If you need subgroup results, plan for it
Many surveys are not just about an overall number. You might need to report results by region, role, tenure, product line, or other segments captured with demographic questions.
Key rule: your margin of error applies to each group only if each group has that many completes. If you need +/- 5% at 95% confidence for each region, then each region needs about 385 completes (or an FPC-adjusted number if the region population is small).
Two practical approaches
- Oversample small groups: deliberately invite a higher share of smaller segments so each segment reaches its target completes.
- Accept wider error for breakouts: keep a strong overall n, but be explicit that subgroup estimates are less precise.
List the segments you must report (not "nice to have"). For each segment, estimate its population share and compute the completes you can realistically achieve. If a segment can only produce 80 completes, do not promise +/- 5% precision for it.
Practical pitfalls: precision vs bias
Sample size planning is about sampling error (random error from not surveying everyone). Real surveys also face systematic error that sample size cannot fix.
Pitfall 1: Treating convenience samples like probability samples
The formulas above assume a probability-style sample (each unit has a known, non-zero chance of selection) and a response process that is not strongly biased. If you use a convenience sample (open link, social media), the calculated "margin of error" can look precise while still being unrepresentative. If you are mixing methods, be transparent about what kind of sampling you actually used.
Pitfall 2: Confusing "bigger n" with "better measurement"
Large n does not help if the question is ambiguous or leading. If you are seeing high item nonresponse (skips) or inconsistent answers, fix the instrument first. Use our guide to write better survey questions to reduce measurement error before you assume you need thousands more responses.
Pitfall 3: Planning precision without a decision
Precision should be tied to a decision or research goal. A sample size is easiest to justify when you can state: "We need to distinguish outcomes that differ by X points" or "We need to estimate the approval rate within +/- Y." Align this with your broader research design (what you will do with the result, and what level of uncertainty is acceptable).
Document your assumptions (justification template)
If you need to justify sample size to stakeholders, include the assumptions in a short, auditable note. Here is a template you can copy into your project brief.
- Population (N): Define the population and the count (for example, "all active customers in the last 90 days, N = 48,200").
- Key metric type: Proportion (percent) vs mean (rating). This article uses the proportion formula, which is common for KPIs reported as percentages.
- Confidence level: Chosen level (90/95/99) and why (for example, industry convention; risk tolerance).
- Margin of error (E): Target precision (for example, +/- 5 points overall; +/- 8 points for subgroups).
- Variability (p): Value used (0.5 conservative, or a prior estimate from a pilot or past surveys).
- Finite population correction: Whether applied and the threshold used (for example, applied because n0 was > 10% of N).
- Completes target (n): Final required completed responses after adjustments.
- Expected response rate: Assumed rate (with justification from history), plus planned invites = n / rate.
- Sampling plan: How you will select invitees (simple random, stratified, etc.) and any oversampling for key segments.
Next steps: fielding and analysis
After you determine targets for completes and invites, your next operational steps are straightforward:
Build the instrument
Draft, test, and refine questions (especially any key KPI items). Start with our question design resources at How to write survey questions.
Implement the sampling approach
Choose how you will draw invitees and how you will treat segments. If you need probability sampling, start with sampling methods.
Field with monitoring
Track completes by segment. If response is lower than expected, increase reminders, extend the field window, or expand invitations (while documenting changes).
Analyze with the planned precision in mind
When reporting results, pair each percentage with its margin of error and avoid overinterpreting tiny movements. Use our survey data guidance to keep reporting aligned with uncertainty.
If you want a second set of eyes on your assumptions (p, E, subgroup needs, or response rate planning), get survey help. When you are ready to field, create a survey and set your invite list size based on the calculations above.
References
- National Institute of Standards and Technology (NIST). (n.d.). Selecting Sample Sizes. In NIST/SEMATECH e-Handbook of Statistical Methods.
- Israel, G. D. (1992). Determining Sample Size (Fact Sheet PD006). University of Florida, IFAS Extension.
- Althubaiti, A. (2023). Sample size determination: A practical guide for health researchers. Journal of General and Family Medicine, 24(2), 72-78.
- Hazra, A., & Gogtay, N. (2016). Biostatistics series module 5: Determining sample size. Indian Journal of Dermatology, 61(5), 496-504.
Frequently Asked Questions
What sample size do I need for 95% confidence and 5% margin of error?
If you are estimating a percentage and you use the conservative assumption p = 0.5, you need about 385 completed responses for a large population. If your population is small (for example, an employee census list), apply finite population correction to reduce the required completes.
Does population size matter for sample size?
Not much for very large populations. Population size matters when your required sample is a sizable share of the population. In those cases, use finite population correction (FPC) to adjust the completes target downward.
If I invite more people, do I eliminate nonresponse bias?
Inviting more people helps you hit your completes target, which improves precision (smaller margin of error). But it does not automatically eliminate nonresponse bias. Bias depends on whether the people who respond differ in relevant ways from those who do not.
What response rate should I assume for invite planning?
Use your own historical response rates whenever possible (same audience and channel). If you do not have history, plan multiple scenarios (for example, 20%, 30%, 40%) and make invitations and reminders your adjustable levers during fieldwork.
How do I handle sample size if I need results by department or region?
Plan sample size at the subgroup level. If you want +/- 5% precision for each subgroup, each subgroup needs roughly the same completes target as the overall estimate (unless subgroup populations are small enough for FPC). Use demographic information and a sampling plan (often stratified or oversampling) to ensure key subgroups reach their targets.
When is p = 0.5 the right choice?
Use p = 0.5 when you do not have a defensible prior estimate for the proportion you are measuring. It is conservative because it yields the largest required sample for a given confidence level and margin of error. If you have prior data or a pilot, you can use that estimate instead.