
Key Takeaways
- A correlational study measures relationships: You observe variables as they naturally occur and quantify how they move together, without manipulating anything.
- Direction and size both matter: Report the sign (positive/negative), the magnitude (how strong), and uncertainty (p-values and/or confidence intervals) before interpreting.
- Surveys are common -- and risky: Good question wording, consistent scales, and bias controls prevent correlations that are artifacts of self-report.
- Plan for confounding early: Identify plausible third variables up front and decide how you will measure and adjust for them (often via regression).
- Write non-causal conclusions: Use language like "is associated with" and add alternative explanations (reverse causality, confounding, measurement bias).
What a correlational research study is (and is not)
A correlational research study is an observational (non-experimental) design where you measure two or more variables and analyze whether they are statistically related. You do not assign people to conditions or manipulate an independent variable. You quantify the relationship, usually with a correlation coefficient (like Pearson's r) and sometimes with related models (like regression).
Most people encounter correlational studies through surveys: you measure attitudes, behaviors, or experiences (Variable A) and compare them to another measure (Variable B) in the same dataset.
If you want a deeper refresher on the basic idea and common coefficients, see our correlational research guide and the core reminder that correlation does not equal causation.
It does not answer "Does A cause B?" To support causal claims you need a different design (for example, an experiment) or substantially stronger assumptions plus stronger evidence.
Examples of correlational questions:
- Is employee engagement associated with intent to stay?
- Is perceived stress associated with anxiety symptoms in students? (A common cross-sectional correlational approach in health research.)
- Do customers who rate service quality higher also report higher likelihood to recommend?
When correlational research is the right choice
Correlational designs are most useful when your goal is to understand patterns, predict outcomes, or prioritize what to investigate next -- not to prove cause and effect. Open textbooks on research methods commonly describe correlational research as appropriate when you're interested in statistical relationships or when experimental manipulation is impractical or unethical (for example, you cannot assign people to experience stress). For background, see the correlational methods overview in Research Methods in Psychology (OpenTextBC).
Use a correlational study when you need to:
- Explore which variables are related before investing in experiments or interventions.
- Validate a measure by checking whether it correlates with another established measure (convergent validity).
- Study real-world constraints where manipulation would be unethical (health outcomes, workplace safety incidents) or impossible (age, past events).
- Build prediction models (for example, which survey items best predict churn risk).
When you should not rely on correlation alone:
- You must decide between two competing interventions.
- You need to quantify a causal effect ("If we increase training hours by 2, what happens to performance?").
- You expect strong confounding and cannot measure key third variables.
If you are deciding among multiple research designs, start from a broader research methods overview so you can match the design to the decision you need to make.
Correlational vs experimental: a quick comparison
The easiest way to avoid overclaiming is to be explicit about what your design can and cannot do.
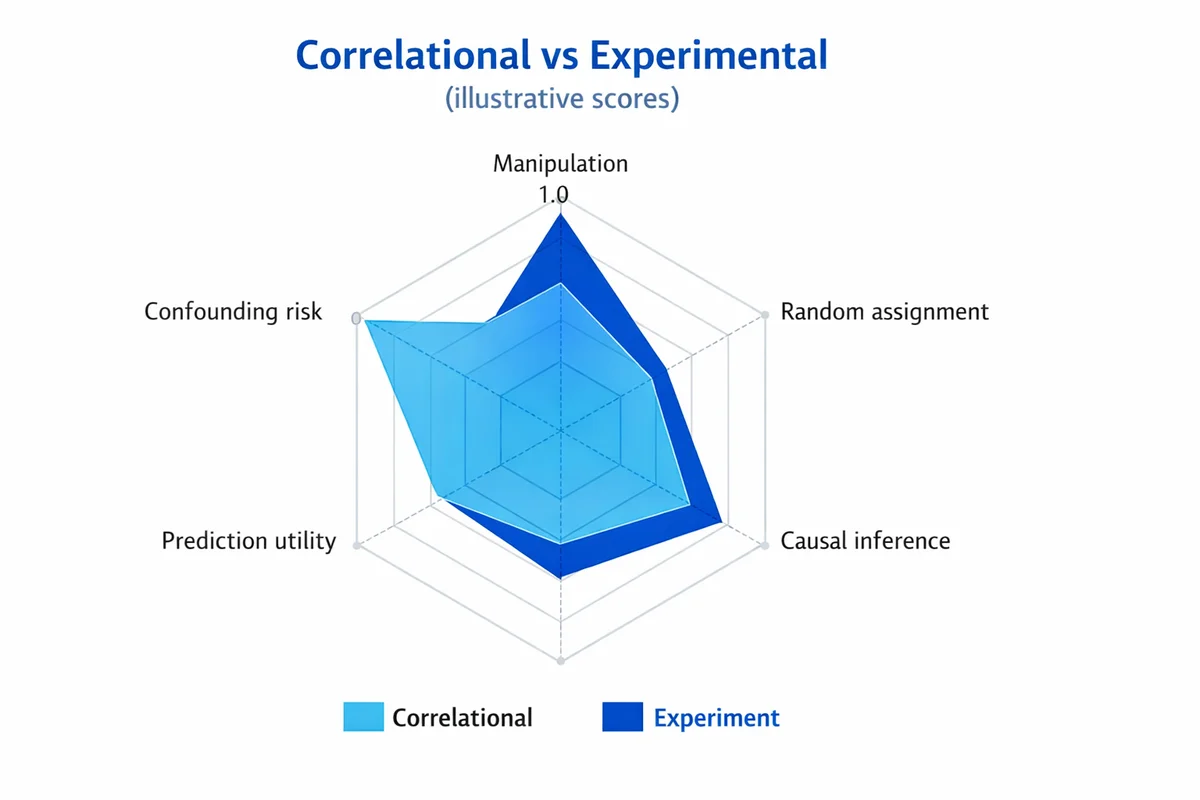
| Feature | Correlational study | Experiment (true experimental) |
|---|---|---|
| What you do | Measure variables as they naturally occur | Manipulate at least one variable and measure outcomes |
| Assignment | No random assignment to conditions | Random assignment (or strong quasi-experimental substitutes) |
| Best for | Describing associations, prediction, hypothesis generation | Estimating causal effects |
| Main threat | Confounding and reverse causality | Implementation issues (noncompliance, attrition), but less confounding |
| Typical language | "Associated with", "related to", "tends to" | "Causes", "increases", "reduces" (when well-designed) |
In survey programs, correlational work is often a first pass: it helps you spot which levers might matter, then you follow up with experiments, phased rollouts, or stronger designs.
Plan the study: variables, hypotheses, and sampling
Correlational studies go wrong most often during planning, not analysis. A little structure up front prevents "we found a correlation" stories that do not replicate.
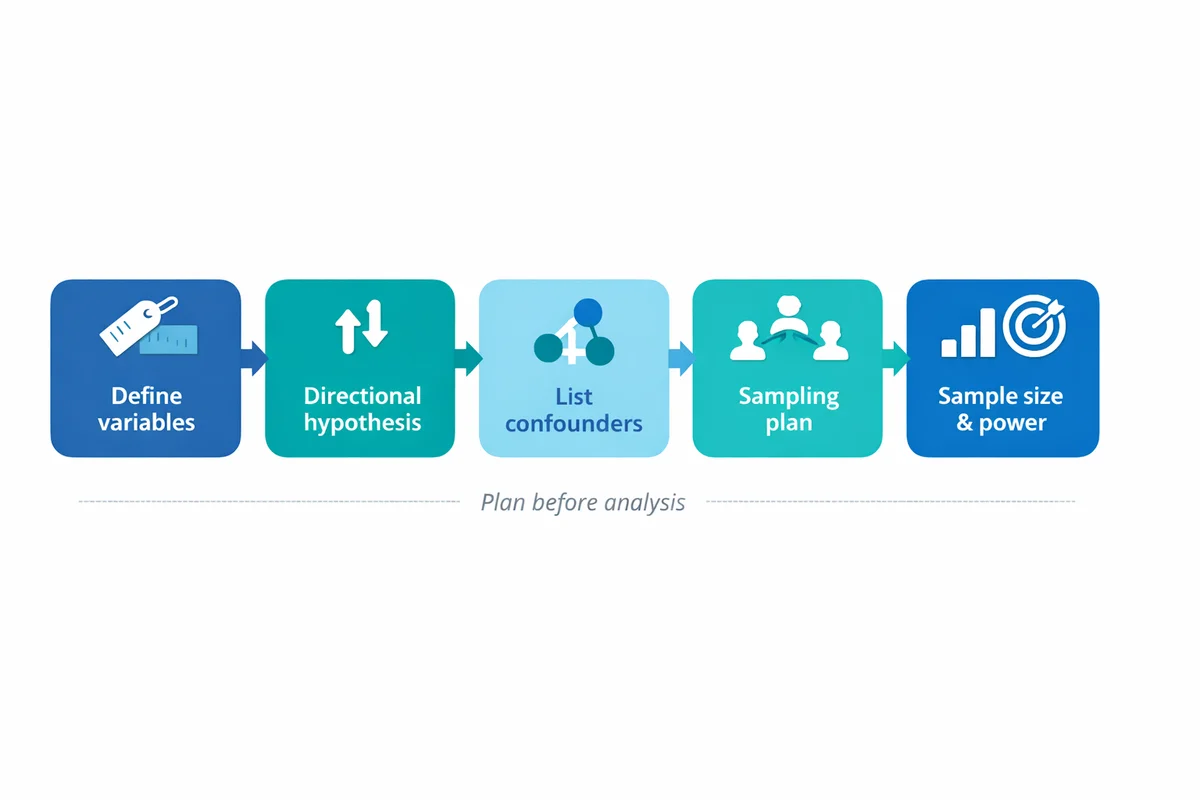
Define variables as measurable constructs
Write a one-sentence operational definition for each variable (what you will measure, with what items, and over what timeframe).
State a directional hypothesis (when you can)
Example: "Higher workload is associated with lower work-life balance." Direction helps interpretation and reduces fishing.
List plausible confounders before you collect data
Ask: "What could cause both variables?" Then decide which you can measure (role, tenure, seasonality, baseline performance).
Choose your sampling plan
Sampling affects both bias and the range of values you will observe. Use our sampling methods guide to decide how you will recruit and what population your conclusions apply to.
Plan sample size with power in mind
Small samples produce unstable correlations (especially when the true relationship is weak). Use sample size guidance to estimate how many responses you need to detect a correlation of practical interest.
Do not ask "Is r different from zero?" first. Ask "What size of relationship would change a decision?" Then plan to detect that size with acceptable uncertainty.
Design survey measures that produce meaningful correlations
Survey-based correlational studies are only as good as their measures. If items are vague, leading, or inconsistently scaled, you can manufacture correlations (or hide real ones).
Start with question quality. If you need a refresher, use our guide on how to write survey questions.
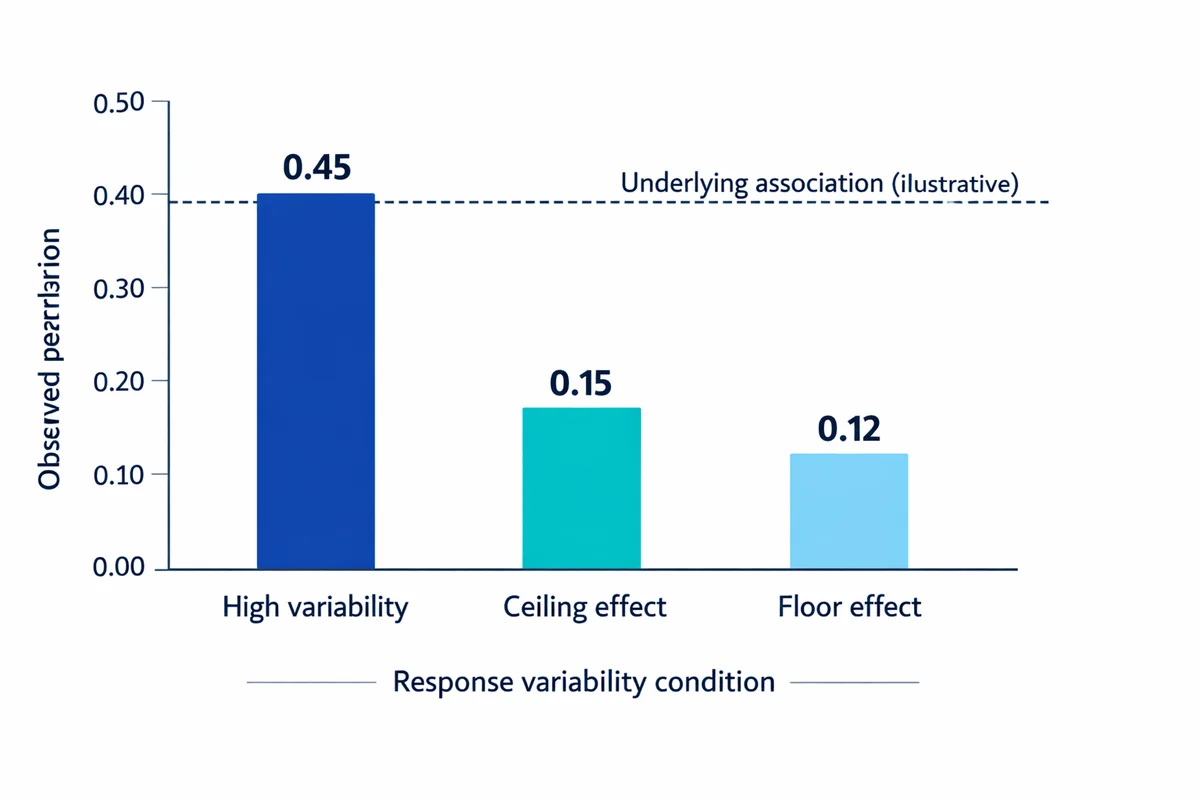
Make sure each variable has variability
Correlation needs variation. If most respondents choose the same option (a ceiling/floor effect), the correlation will be attenuated (pulled toward zero) even if a relationship exists.
- Avoid extreme wording: "always"/"never" can compress responses.
- Use consistent timeframes: "in the last 7 days" vs "in general" can weaken relationships.
- Match scale direction: Keep higher scores meaning "more" of the construct to reduce coding errors.
Choose response scales you can analyze responsibly
Many survey variables are ordinal (ordered categories). Likert-type items are a common example. See Likert scale questions for options and caveats.
For correlational analysis, you have two common patterns:
- Composite scores: Average multiple Likert items into a scale (often treated as approximately interval). This can be reasonable when the scale is reliable and has 5-7 points.
- Rank-based methods: Use Spearman correlation for ordinal variables or when relationships are monotonic but not linear.
Reduce common-method bias (survey-specific)
When both variables come from the same survey at the same time, correlations can be inflated by shared method rather than a real relationship (for example, a general "positivity" response tendency).
Practical mitigations:
- Separate measures in the questionnaire (different sections) and vary item formats.
- Use behavioral or administrative data for one variable when possible (for example, tenure from HRIS).
- Include attention checks and data-quality checks (see cleaning and preparing survey data).
Collect correlational data: surveys, observation, secondary data
Correlational data can be collected in many ways. A survey-first approach is common in business and HR because it is fast, scalable, and can measure hard-to-observe constructs (attitudes, perceptions). Open resources on correlational methods describe surveys, naturalistic observation, and archival/secondary data as core options (see Lau (2017), Handbook of eHealth Evaluation).
Option A: Surveys (most common for teams and customer programs)
Use surveys when you need self-reported experiences or standardized measures across many respondents. If you are implementing quickly, you can create a survey to measure two variables and capture both constructs in the same instrument.
Option B: Naturalistic observation
Use observation when self-report is unreliable or when behavior is the construct. Plan standardized coding rules so observers measure the same thing in the same way.
Option C: Secondary/archival data
Use existing datasets (HR, CRM, learning platforms) when the measures already exist and quality is acceptable. The upside is scale; the downside is you inherit how the data were defined and recorded.
Cross-sectional vs longitudinal (timing matters)
Most survey correlations are cross-sectional: one snapshot. Longitudinal designs measure variables over time, which can help you rule out some interpretations (though it still does not guarantee causality). Cross-sectional correlational designs are common in applied health and education research (for example, studies assessing relationships among stress, anxiety, and coping in student populations). See an example of a cross-sectional correlational study in Onieva-Zafra et al. (2020).
Prepare your dataset before you run correlations
A correlation coefficient is sensitive to coding mistakes, missing data, and outliers. Do basic preparation before analysis (and document it so you can defend decisions later). Our data quality checks guide covers the broader workflow; below are the correlation-specific essentials.
- Check coding direction: Make sure higher values mean more of the construct for both variables (or document reverse-coding).
- Handle missing data intentionally: Pairwise deletion can change N across correlations; listwise deletion can shrink N fast. Choose a rule and report it.
- Inspect outliers: A few extreme points can drive r. Use a scatter plot and consider robust or rank-based correlation if needed.
- Watch for range restriction: If your sample is too homogeneous (all high performers), observed correlations can be smaller than in the full population.
Analyze correlational data: coefficient, significance, and beyond
A basic analysis has three parts: (1) visualize, (2) compute an appropriate coefficient, (3) quantify uncertainty. If more than two variables matter, move beyond correlation to multivariable modeling.
1) Visualize first (scatter plots and grouped plots)
Before any coefficient, plot the relationship. Look for:
- Linearity: Pearson's r measures linear association; a curved pattern can yield r near 0 even when variables are strongly related.
- Clusters: Subgroups (departments, regions) can create misleading overall correlations.
- Outliers: A few points can dominate the result.
2) Choose the right correlation coefficient
| Your variables | Typical survey example | Recommended approach | Why |
|---|---|---|---|
| Two continuous, roughly linear | Composite engagement score vs tenure (months) | Pearson correlation (r) | Measures linear association between continuous variables |
| Ordinal or non-normal / monotonic | Single Likert item (1-5) vs another Likert item | Spearman rank correlation (rho) | Uses ranks; more robust to non-normality and ordinal scales |
| Binary and continuous | Churned (yes/no) vs satisfaction score | Point-biserial correlation (special case of Pearson) | Equivalent to correlation with a 0/1 coded variable |
| Two binary variables | Completed training (yes/no) vs promoted (yes/no) | Phi coefficient | Correlation for two dichotomies |
When your analysis goal is adjustment ("controlling for other variables"), correlation is not enough. Use regression or related models. See regression vs correlation for practical next steps.
3) Add statistical significance and uncertainty
A coefficient alone is incomplete. Report uncertainty so readers can distinguish signal from noise.
- p-value: Tests whether the correlation differs from 0 given assumptions. See statistical significance explained.
- Confidence interval (CI): A range of plausible values for the true correlation; often more informative than a binary "significant/not" label.
- N (effective sample size): Especially important with missing data rules.
Also consider practical significance: even a statistically significant r can be too small to matter operationally if it does not change what you do next.
Interpret and report results without causal overreach
The interpretation job is to connect statistics to meaning, while staying inside what correlational evidence can support.
Interpret direction and magnitude
Direction is straightforward:
- Positive correlation: higher A tends to occur with higher B.
- Negative correlation: higher A tends to occur with lower B.
- Near zero: no linear (or monotonic) association in your data.
Magnitude is context-dependent. "Strong" in psychology may not be "strong" in operational metrics. Instead of rigid cutoffs, interpret in terms of decision impact (what would you change if the relationship were real?).
Use wording that matches the design
Preferred correlational wording:
- "X is associated with Y"
- "Respondents with higher X tended to report higher/lower Y"
- "We observed a relationship between X and Y"
Avoid causal verbs unless you have causal identification: "causes", "leads to", "drives", "impacts".
A reporting template you can copy
Association: "We found a [positive/negative] association between X and Y (r = __, 95% CI [__, __], N = __, p = __)."
Interpretation: "This suggests that respondents reporting higher X also tended to report [higher/lower] Y."
Limits: "Because this is correlational and cross-sectional, alternative explanations include confounding (e.g., Z) and reverse causality."
If you do adjust for confounders with regression, add: "In a regression model adjusting for [covariates], the association between X and Y was [smaller/similar] (beta = __, p = __)."
Common pitfalls in survey-based correlational studies (and how to avoid them)
Competitor guides often warn "correlation is not causation" but stop there. In practice, you need to anticipate specific failure modes and design around them.
1) Confounding (the third-variable problem)
A third variable Z influences both X and Y, creating a relationship that is not directly about X and Y. Example: managerial support could raise both engagement and intent to stay.
Mitigation: measure key confounders and use stratified plots, partial correlations, or regression (using regression to adjust for other variables).
2) Reverse causality (directionality ambiguity)
Even if X and Y are related, you may not know which comes first. Example: does burnout lower performance ratings, or do low performance ratings increase burnout?
Mitigation: use longitudinal measurement (X at time 1, Y at time 2), or use designs that establish temporal ordering.
3) Response bias and self-presentation effects
In employee and customer surveys, people may answer in socially desirable ways or systematically over/under-report behaviors. That can distort correlations (inflate or attenuate them). See response bias for common patterns and fixes.
4) Common-method bias (single-source inflation)
If both variables come from the same instrument, same scale format, same moment, and same respondent mindset, your correlation can be partly measurement artifact.
Mitigation: mix data sources (survey + admin), separate measures, and avoid reusing identical scale anchors for everything.
5) Multiple comparisons and "dashboard correlation mining"
If you compute 100 correlations, some will look "significant" by chance. Treat exploratory screens as hypothesis generation, and confirm in a new sample or with pre-registered hypotheses.
Worked example: a correlational study you can run with a survey
Scenario: You want to know whether employee role clarity is related to intent to stay, and whether that relationship holds after accounting for tenure and manager effectiveness.
Research question
"Is role clarity associated with intent to stay among employees?" (Non-causal phrasing.)
Variables and measures
Role clarity (X): 4-item Likert scale (1-5) averaged into a composite.
Intent to stay (Y): 1 item (0-10 likelihood to stay 12 months).
Confounders: tenure (months), manager effectiveness (composite).
Sampling and fielding
Define the population (all full-time employees). Choose a sampling approach and recruitment plan (see sampling in survey research). Launch the survey with consistent timing and reminders.
Data prep
Remove duplicates, check for straightlining, verify reverse-coded items, and decide how to treat missing values (see working with survey datasets).
Primary analysis
Compute a scatter plot (role clarity composite vs intent to stay). Compute Pearson r (or Spearman if you prefer rank-based robustness). Add N, CI, and p-value.
Adjusted analysis
Fit a regression model predicting intent to stay from role clarity, tenure, and manager effectiveness (multivariable analysis basics). Compare the role clarity association before and after adjustment.
Interpretation
If the association weakens after adjustment, your initial correlation may have been partly confounded. If it remains, it supports (not proves) the idea that role clarity is independently related to intent to stay.
What this does (and does not) let you say:
- You can say: "Role clarity is associated with intent to stay, even after accounting for tenure and manager effectiveness."
- You cannot say: "Improving role clarity will increase retention" (unless you test an intervention or have a strong causal design).
Correlational studies are widely used to examine relationships between variables, but they do not, on their own, establish causality.
Jhangiani et al., OpenTextBC
References
- Jhangiani RS, Chiang I-CA, Cuttler C, Leighton DC. Correlational research. In: Research Methods in Psychology (2nd Canadian Edition). OpenTextBC. 2021.
- Lau F. Chapter 12: Methods for correlational studies. In: Lau F, Kuziemsky C, editors. Handbook of eHealth Evaluation: An Evidence-Based Approach. University of Victoria; 2017. (NCBI Bookshelf).
- Onieva-Zafra MD, Fernandez-Munoz JJ, Fernandez-Martinez E, et al. Anxiety, perceived stress, and coping strategies in nursing students: a cross-sectional, correlational, descriptive study. BMC Medical Education. 2020;20:370.
- Nemati-Vakilabad R, Kamalifar E, Jamshidinia M, et al. Assessing the relationship between nursing process competency and work environment among clinical nurses: a cross-sectional correlational study. BMC Nursing. 2025;24:2760.
- Gao W, Chen J, Tu Z, Li M. Correlational research on college students' physical exercise behavior, academic engagement, and self-efficacy. Frontiers in Psychology. 2025. Available from: PubMed.
- Whitcomb DA, Carrasco RC, Neuman A, Kloos H. Correlational research to examine the relation between attachment and sensory modulation in young children. American Journal of Occupational Therapy. 2015. Available from: PubMed.
Frequently Asked Questions
Can a correlational study prove causation?
No. A correlational study can show that variables move together, but it cannot, by itself, establish that one causes the other. Common alternative explanations are confounding (a third variable affects both) and reverse causality (the direction is unclear).
What is the difference between correlation and regression?
Correlation summarizes the relationship between two variables with one number (direction and strength). Regression models an outcome as a function of one or more predictors, which lets you adjust for additional variables and estimate conditional relationships. See regression vs correlation.
Should I use Pearson or Spearman for Likert data?
If you are correlating single Likert items (ordinal), Spearman is often safer because it uses ranks. If you have reliable multi-item composites with 5-7 response options, many teams use Pearson as an approximation. The more important rule is: plot the relationship and choose a method that matches the data shape and measurement level.
What sample size do I need for a correlational study?
It depends on the smallest correlation that would matter to you, the significance threshold, and the power you want. Use sample size for correlation planning to avoid unstable estimates and "significant" results that do not replicate.
Why is my correlation close to zero even though the relationship seems real?
Common reasons are range restriction (your sample is too uniform), a nonlinear relationship (curved pattern), measurement error (noisy survey items), or subgroup effects (different patterns by department/region). Visualizing the data usually reveals which issue is present.
How do I write conclusions for correlational results?
Use non-causal language ("associated with"), report the coefficient and uncertainty (CI, p-value, N), and include plausible alternative explanations (confounding, reverse causality, bias). If you adjusted for confounders in regression, state which variables you controlled for and how conclusions changed.