
Key Takeaways
- Start with decisions, not questions: Define the decision your survey will support, the target population, and the estimates you need before writing items.
- Match design to change over time: Use cross-sectional for a snapshot, longitudinal/panel for change, and repeated cross-sections when tracking trends without recontacting the same people.
- Sampling drives credibility: Prefer probability approaches when you need defensible inference; if you must use non-probability samples, plan bias checks and be cautious in claims.
- Mode and measurement are linked: Device and channel affect who responds and how they answer; design questions and scales for the mode you will field.
- Quality control is a design method: Build in prevention (good wording, length control), detection (speeding, straightlining), and repair (cleaning rules, weighting) before launch.
- Report for action: Document sampling, field dates, response metrics, and limitations, then translate results into decisions and next steps.
What survey research design means (and what it is not)
Survey research design is the set of choices that turn an information need into measurable data you can trust: the design type (snapshot vs change), who you will survey (sampling), how you will reach them (mode), how you will measure concepts (questions and scales), and how you will analyze and report results.
It helps to separate design from methods. Design is the plan (what you will estimate, from whom, and with what level of precision). Methods are the techniques you use to execute the plan (specific sampling methods, question formats, recruitment tactics, and analysis steps). For a quick refresher on research design basics, keep that distinction in mind as you read.
A strong survey design makes your results reproducible: someone else could follow your plan, field a similar survey, and get estimates that differ only within expected error. Get started now with our free survey maker
Choose your design type (snapshot, trend, panel, or experiment)
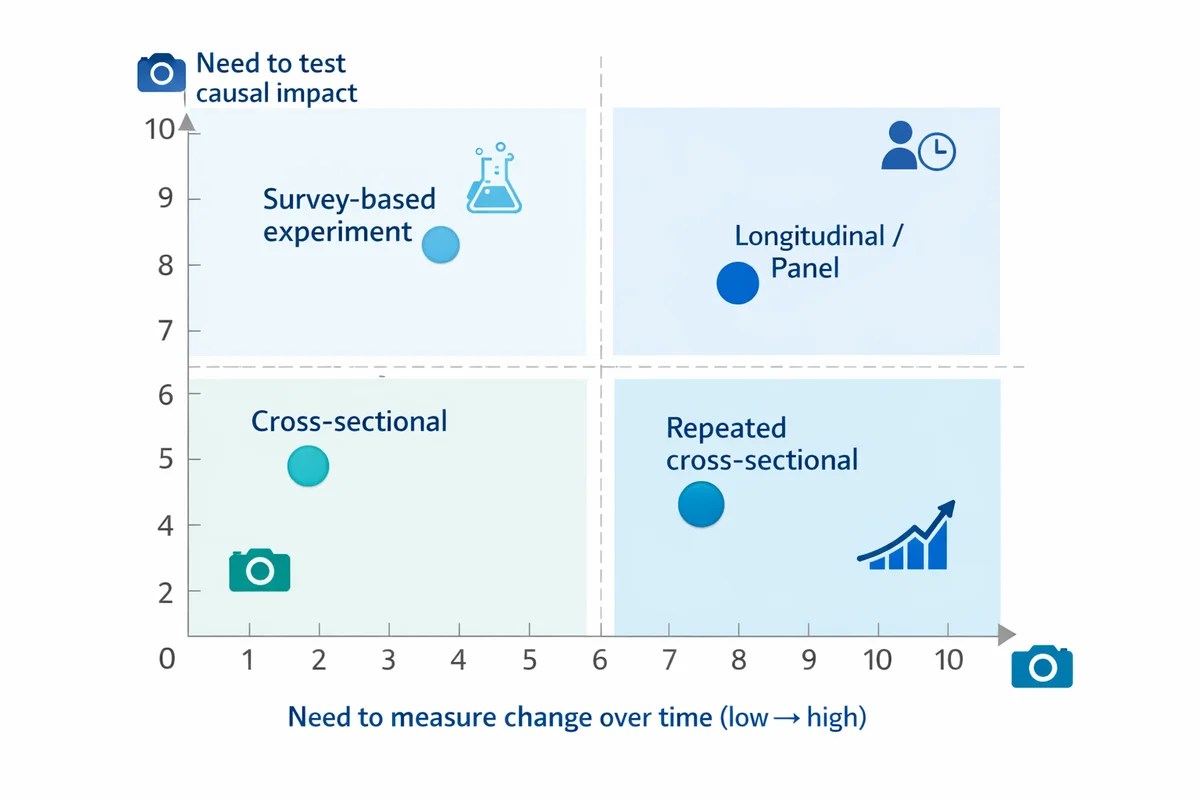
Most survey projects fall into one of four design types. The right choice depends on whether you need to describe a moment, track change, explain relationships, or test alternatives.
| Design type | Best for | Typical example | Main tradeoff |
|---|---|---|---|
| Cross-sectional | One-time snapshot of attitudes/behaviors | Measure customer satisfaction this quarter | Cannot separate age effects vs time effects; limited causal claims |
| Repeated cross-sectional | Trends over time without recontacting the same people | Monthly brand tracking with fresh samples | Change may reflect sampling differences unless tightly controlled |
| Longitudinal / panel | Individual-level change and drivers of change | Survey the same employees every 6 months | Panel conditioning, attrition, and higher cost |
| Survey-based experiment | Test wording, concepts, or messages (causal inference on the manipulation) | A/B test two policy descriptions and compare support | External validity depends on realistic stimuli and sample coverage |
If you are measuring relationships rather than testing an intervention, you are often doing correlational analysis. When appropriate, link your plan to a framework like correlational research so stakeholders do not over-interpret associations as causes.
Define your population, unit of analysis, and allowable claims
Survey designs succeed or fail on a simple question: who do your results describe? Define:
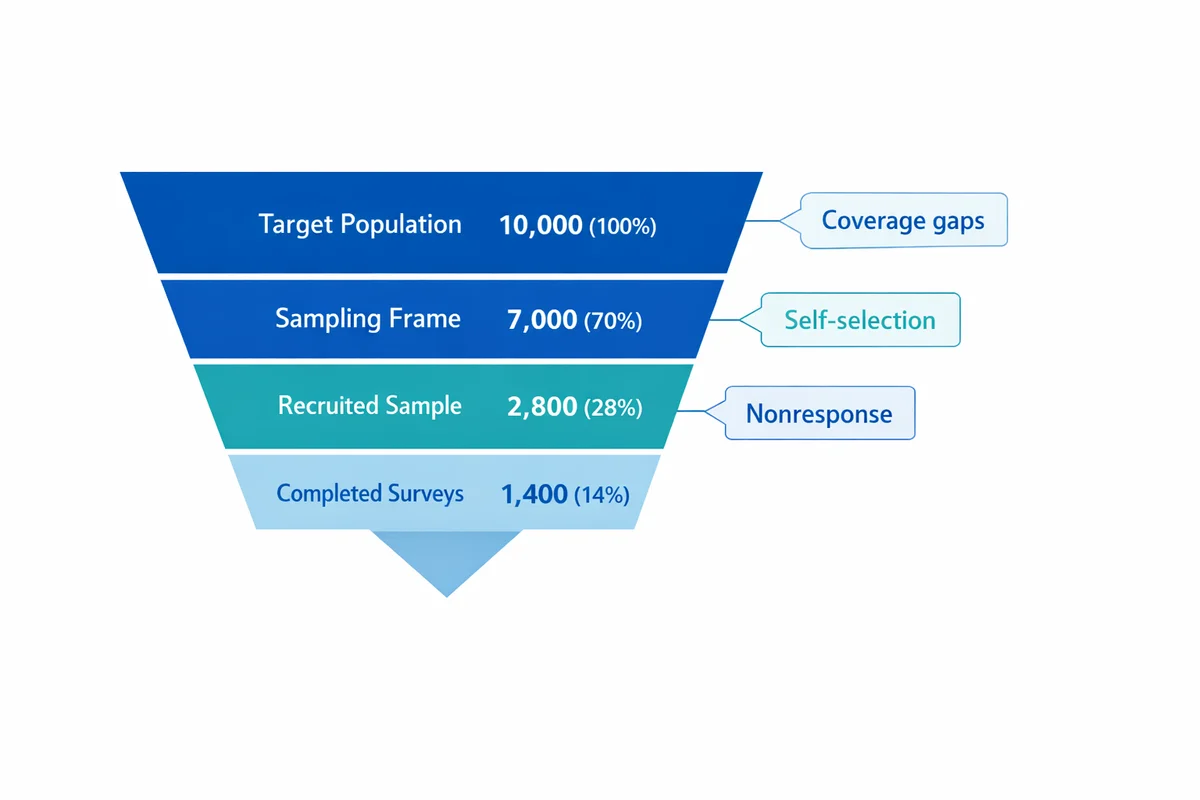
- Target population: The group you want to generalize to (not just who is easiest to reach).
- Sampling frame: The list or source you will actually recruit from (often smaller than the population).
- Unit of analysis: Person, household, account, visit, transaction, etc. (This affects screening and weighting.)
- Key estimates: A mean score, a percent selecting an option, or a difference between groups.
Write your intended claim in one sentence before you write questions, for example: "Among active customers in the US in Q2, estimate the percent who would recommend us, overall and by plan tier." This sentence will drive your sampling and your reporting language.
For deeper background on survey data structures and how design choices affect datasets, see Data.
Select a sampling approach (and plan for bias)
Sampling is your method for choosing participants from the population. Start with sampling methods and decide whether you need probability sampling (known, non-zero selection chances) or can accept a non-probability approach (convenience, volunteer, opt-in panels).
Rule of thumb: The more you need to generalize to a broader population, the more your design should lean toward probability sampling or at least strong coverage and weighting plans. Survey methodology texts and government research programs emphasize that sampling and nonresponse are central error sources, not afterthoughts.
When you cannot use probability sampling (common in product feedback or fast pulse surveys), do two things: (1) narrow your claims to your reachable frame, and (2) build explicit checks for response bias (for example, compare early vs late respondents, or compare your sample demographics to a known benchmark).
List the top 3 ways your sample could differ from the population (coverage gaps, self-selection, nonresponse). For each, write one prevention tactic and one detection tactic you will use.
Plan sample size, precision, and recruitment targets
Sample size is not just "how many completes." It is also how many you need in key subgroups (regions, roles, customer tiers) to make comparisons with acceptable uncertainty. Use sample size guidance to translate a margin-of-error goal into a completion target.
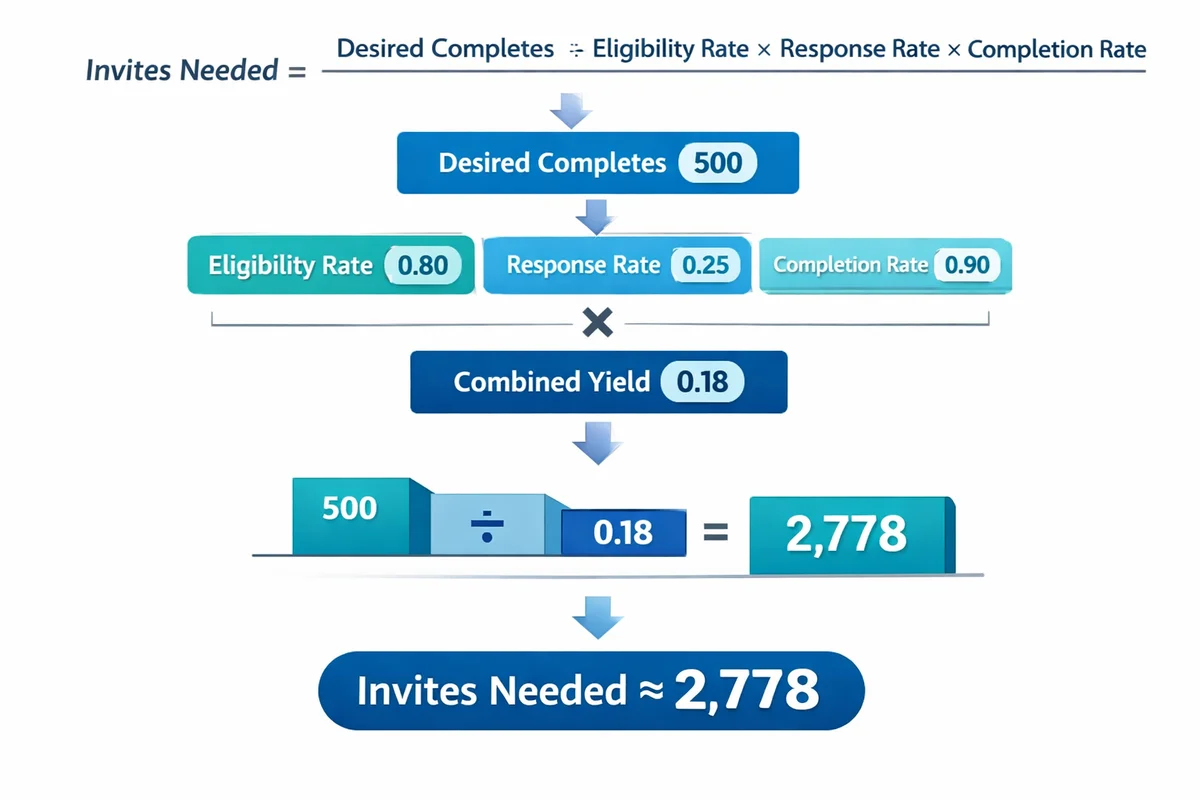
Then work backward to a recruitment plan. Your invites needed is driven by expected eligibility, response rate, and breakoff (drop-off). A simple planning equation:
- Invites needed = desired completes / (eligibility rate x response rate x completion rate)
If you have multiple channels (email list plus in-product intercept), calculate this per channel because response behavior differs by mode and context.
Choose survey mode and contact strategy
Mode is how people receive and answer your survey: web/mobile, SMS, phone, mail, in-person, or mixed-mode. Mode affects coverage (who you can reach), measurement (how people interpret and answer), and cost/time.
| Mode | Strengths | Risks | Design tips |
|---|---|---|---|
| Web / mobile | Fast, low cost, good for visuals and branching | Coverage gaps; speeding and satisficing; device variability | Mobile-first layout, short pages, test on small screens |
| SMS-to-web | High open rates in some audiences; quick pulses | Short attention window; higher breakoff if long | Keep to essentials; avoid grids; use large tap targets |
| Phone | Can reach some hard-to-reach groups; interviewer clarifies | Interviewer effects; cost; declining pickup rates | Shorter items, avoid complex scales, train probes consistently |
| Accessible for low-digital groups; tangible invitation | Slow, data entry, lower flexibility | Clear cover letter, simple formatting, prepaid return | |
| Mixed-mode | Improves coverage and response | Mode effects can shift answers | Keep question wording and visual design as equivalent as possible |
Your contact strategy is part of mode design: how many reminders, how spaced, and what you say in each message. Keep the ask consistent with your privacy promises and incentives.
Design the questionnaire: measures, scales, and question order
Once your design, sample, and mode are set, move to questionnaire design. If you want a complete playbook, use how to write survey questions as your companion guide. Here are the survey-design decisions that most affect data quality:
Define each construct in plain language
Example: "satisfaction" could mean product quality, support experience, value for money, or likelihood to repurchase. Write the definition you will use and align items to it.
Choose response formats that match analysis
If you need a percentage, use a categorical option set. If you need a scale score, use a rating or agreement scale consistently.
Keep the cognitive load low
One idea per question. Avoid long stems, double negatives, and hidden assumptions.
Order for flow and minimal bias
Start with easy, relevant questions; group topics; place sensitive items later; and avoid priming key outcomes with leading context.
Closed-ended questions: categories, multiple choice, and missing options
Closed-ended formats make analysis easier, but only if the options fit how respondents think. For guidance on multiple-choice questions, focus on these checks:
- Mutually exclusive: Options do not overlap (respondent should not wonder which is "more correct").
- Collectively exhaustive: Include "None of the above" or "Other (please specify)" when needed.
- Balanced and ordered: Logical ordering (e.g., low to high) and no hidden judgment language.
Attitudes and intensity: Likert vs rating scales
Agreement scales are common, but they are not always the best choice. Use Likert scale questions when you are measuring agreement with a clear statement and you want to combine multiple items into a scale (index) for reliability.
Use rating scale questions when you want an evaluative score of an object (service, feature, experience) and you will interpret averages or top-box percentages. Decide up front whether you will treat the scale as ordinal (ranked) or approximately interval (differences matter) because it affects your analysis choices.
Open-ended questions: qualitative depth without drowning in text
Open-ended questions are most useful when you need discovery (what issues exist) or explanations (why someone chose a rating). Limit them to a few high-value prompts and make the question specific ("What is the main reason for your score?"). Plan how you will code responses into themes before you field.
Demographics and segmentation (including sensitive items)
Demographics help you check representativeness and analyze differences between groups. Use demographic questions strategically:
- Ask only what you will use (analysis, weighting, eligibility).
- Place sensitive demographics late, unless needed for routing.
- Offer "Prefer not to say" where appropriate and explain why you ask.
Pilot test, then launch with response-rate tactics
Piloting is a survey design method, not a nice-to-have. Do a small test with people similar to your target respondents to catch confusing wording, broken logic, and device issues. Methodology guidance commonly recommends pretesting to reduce measurement error before fielding at scale.
Run a soft launch
Field to 1-5% of your invite list. Verify completion time, drop-off points, and whether quotas or screeners behave as expected.
Optimize the invitation
Make the purpose concrete, keep it short, and set expectations (time to complete, closing date). Avoid overpromising anonymity if you cannot deliver it.
Use reminders intentionally
Plan 1-3 reminders spaced a few days apart. Change only one element (subject line or first sentence) so you learn what works.
Making the survey longer than advertised, hiding eligibility screen-outs after multiple pages, and using incentives without clear rules (people share links, inviting fraud).
When you are ready to implement, build your survey in software and confirm your skip logic, randomization (if any), and mobile layout.
Data quality and bias controls (before, during, after fieldwork)
Survey error does not come from one place. It accumulates from coverage, sampling, nonresponse, measurement, and processing. Make quality controls part of your design methods.
Before fieldwork: prevent low-quality data
- Keep it short: Cut nice-to-know items. Longer surveys increase breakoff and satisficing.
- Use clear definitions: Define time frames ("in the last 30 days") and terms ("active user"), especially for behaviors.
- Reduce leading cues: Avoid emotional framing and one-sided examples in question stems.
During fieldwork: detect issues early
- Monitor completion time distribution and drop-off points.
- Track item nonresponse (skips) by question; spikes often indicate confusion or sensitivity.
- Check quota fills; unexpected skews can signal coverage problems.
After fieldwork: cleaning rules you can defend
Write your cleaning rules before you look at results. Common defensible rules include: removing duplicate respondents, excluding impossible completion times (based on pilot medians), and flagging straightlining on long grids. Keep a log so you can explain what changed and why.
Bias is not only "bad respondents." It can be systematic differences in who responds or how they interpret questions. Use your earlier bias plan and revisit how to reduce bias in surveys when interpreting results.
Ethics, consent, and privacy (anonymity vs confidentiality)
Ethics is part of survey design because it changes who participates and how honestly they respond. At minimum, your introduction should cover: who is running the study, what it is for, what you will do with responses, expected time, incentives (if any), and how to opt out.
Be precise about privacy language:
- Anonymity: You do not collect identifiers that let you link responses back to a person.
- Confidentiality: You may collect identifiers, but you restrict access and report results in ways that do not expose individuals.
For practical policies and controls (access, retention, PII handling, and secure sharing), see survey privacy.
If a question could reasonably create risk (job security, health, illegal activity), justify its necessity, minimize identifiability, and report only in aggregates with small-cell suppression rules.
Build the analysis plan into the design
Analysis should not be an afterthought. A simple analysis plan (one page) prevents you from collecting data you cannot use and helps you avoid "fishing" for results.
Your plan should specify:
- Primary outcomes: the 3-5 metrics you will report first.
- Key cuts: which subgroups matter and minimum sample sizes per subgroup.
- Weighting approach: if you will weight, what variables and benchmarks you will use.
- Significance rules: if you will test differences, define thresholds and multiple-comparison handling. (See significance for plain-language interpretation.)
- Open-text coding: theme approach, coding reliability checks, and how you will summarize quotes.
If you expect to model drivers (for example, what predicts likelihood to recommend), plan the predictors and checks for multicollinearity before you run regression.
Report results so people can trust them (and use them)
Many survey reports fail because they hide the methods. A useful report separates what you found from how you found it and what it means.
- Methods box: Population, frame, mode, field dates, completes, and key limitations.
- Response metrics: Invite counts, eligibility, completion rate, and how you handled partials.
- Uncertainty: Provide margins of error (where appropriate) or confidence intervals for key estimates.
- Decision framing: Tie findings to actions, owners, and timelines (not just charts).
If your survey is programmatic (e.g., monthly), create a consistent dashboard structure so stakeholders learn where to look first. SuperSurvey users often start from Dashboard views for ongoing tracking and then publish periodic deep-dive reports.
Worked example: a complete survey design in one page
Below is a compact example you can copy into a doc as your survey design worksheet. Scenario: you manage a subscription product and need to reduce churn.
| Decision | Which churn drivers should we fix first in the next quarter? |
|---|---|
| Target population | Active subscribers in the last 60 days, US + Canada |
| Design type | Cross-sectional (quarterly pulse) plus repeated cross-sectional trendline |
| Sampling & quotas | Email list frame; quota by plan tier and region to ensure subgroup stability |
| Sample size | Target N based on minimum subgroup sizes (e.g., at least 200 per tier) and overall precision |
| Mode | Email-to-web; mobile-first; 2 reminders |
| Primary measures | Renewal intent (0-10), feature satisfaction (1-5), support experience (1-5), top reasons for dissatisfaction (multi-select), open-text improvement prompt |
| Question plan | Start with overall rating, then drivers, then reasons, then open-ended, then demographics |
| Data quality | Soft launch; attention check only if needed; speed flags; remove duplicates; document exclusions |
| Bias checks | Compare sample demographics to customer base; early vs late respondent comparison; sensitivity analysis with and without weights |
| Reporting | 1-page exec summary + appendix with methods and full item distributions |
To build the actual questionnaire, start from proven survey templates like Product-Feedback, Customer-Satisfaction, or Employee-Engagement and adapt the measures to your constructs.
References
- Fowler, F. J., Jr. (2013). Survey Research Methods (5th ed.). SAGE Publications.
- University of Minnesota Information Technology. (n.d.). Survey Project Design.
- U.S. Census Bureau. (n.d.). Survey Methods Research (working papers and methodological research).
- Statistics Canada. (n.d.). Survey Methodology (peer-reviewed journal).
- Harvard Library. (n.d.). GOV 1010: Survey Research Methods (research guide).
Frequently Asked Questions
What is the difference between survey design and a questionnaire?
Survey design is the end-to-end plan (population, sample, mode, timing, measures, analysis, and reporting). A questionnaire is one component: the set of questions and response options used to measure what you need.
When should I use a longitudinal (panel) survey?
Use a panel when you need individual-level change (who improved, who churned, what changed first). If you only need population trends, repeated cross-sectional surveys are often simpler and avoid attrition and conditioning.
How do I choose between Likert and 0-10 rating scales?
Use Likert-style agreement scales for attitudes toward statements and multi-item indexes (e.g., engagement). Use 0-10 or 1-5 ratings for evaluating a specific object or experience (e.g., satisfaction with support). Decide early how you will summarize results (mean, top-box, distribution) and keep scales consistent within a report.
Do I need an attention check question?
Not always. For high-stakes surveys or open links with incentives, attention checks can help detect low-effort responses. For trusted internal lists, they can annoy respondents and create unnecessary exclusions. If you use them, document the rule (what fails, how many fails allowed) before fielding.
What should I include in a methods statement?
At minimum: target population, sampling frame, mode, field dates, number of completes, how partials were handled, any weighting, and key limitations (coverage, nonresponse, measurement). This is the information readers need to judge how far the results generalize.