
Build a Survey with AI (Skip the How-to)
Describe the survey you need and our AI will build it for you in seconds ready to share.
Key Takeaways
- Start with decisions, not questions: Define what you will decide after the survey and what evidence would change your mind.
- Sample and distribution are part of design: Who you invite (and how) can matter more than perfect wording.
- Use consistent scales and clear options: Label endpoints, keep direction consistent, and avoid overlapping choices.
- Pilot before launch: A short test run catches confusing wording, broken logic, and missing response options.
- Plan analysis up front: Decide how you will summarize results, handle open text, and communicate actions before you collect data.
The survey workflow (so you do not miss steps)
If you want a survey that produces usable results (not just responses), treat it like a small research project: define the decision, design the measurement, run quality checks, then interpret and act.
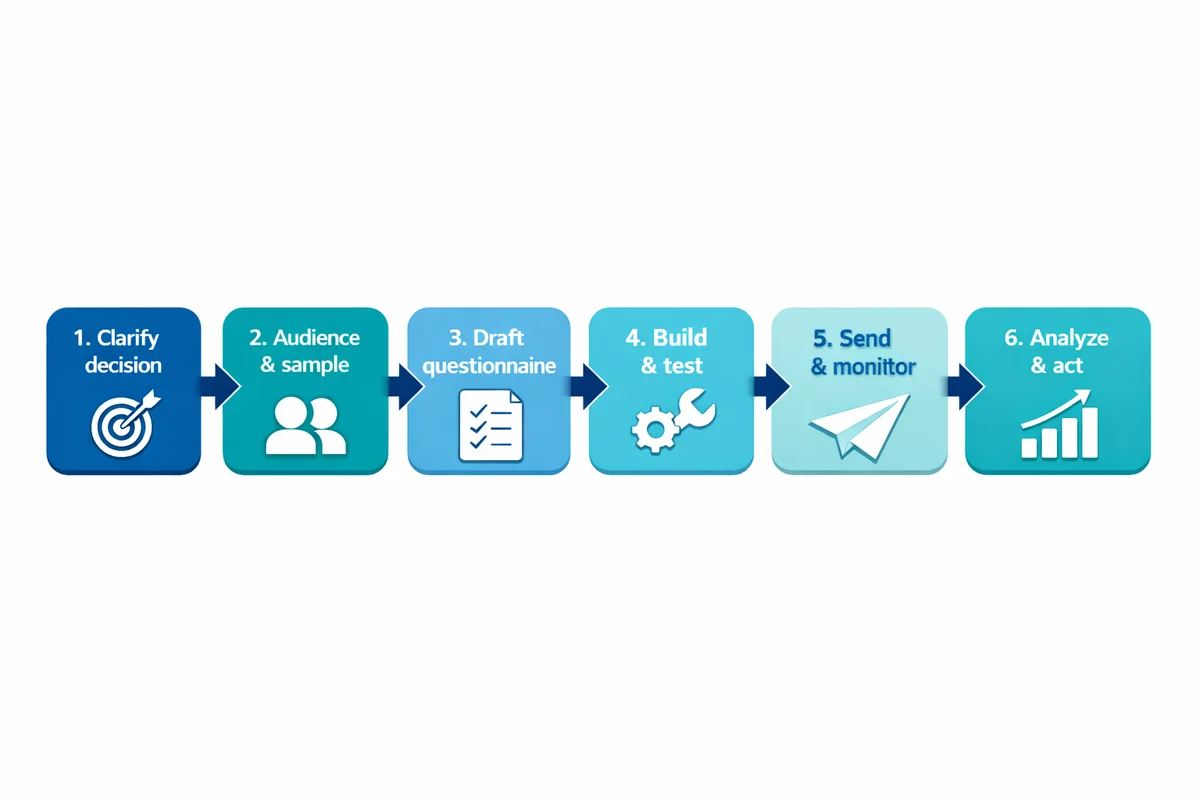
Clarify the decision
Write a 1-sentence objective and what you will do differently based on the result.
Define the audience and sample
Who should answer, how you will reach them, and how many completes you need.
Draft the questionnaire
Choose question types, write items, and design answer options and scales.
Build and test
Implement logic, mobile formatting, and run a pilot with real respondents.
Send and monitor
Use a clear invitation, reminders, and basic fieldwork checks (drop-off, speeders).
Analyze and act
Clean data, summarize, interpret with context, and close the loop with respondents.
Step 1: Define your objective and success criteria
Most survey failures come from vague goals ("measure satisfaction") that do not translate into decisions. Tighten your objective until it is answerable.
"After we see the results, we will decide _______. We need evidence about _______." If you cannot fill this in, your survey is not ready.
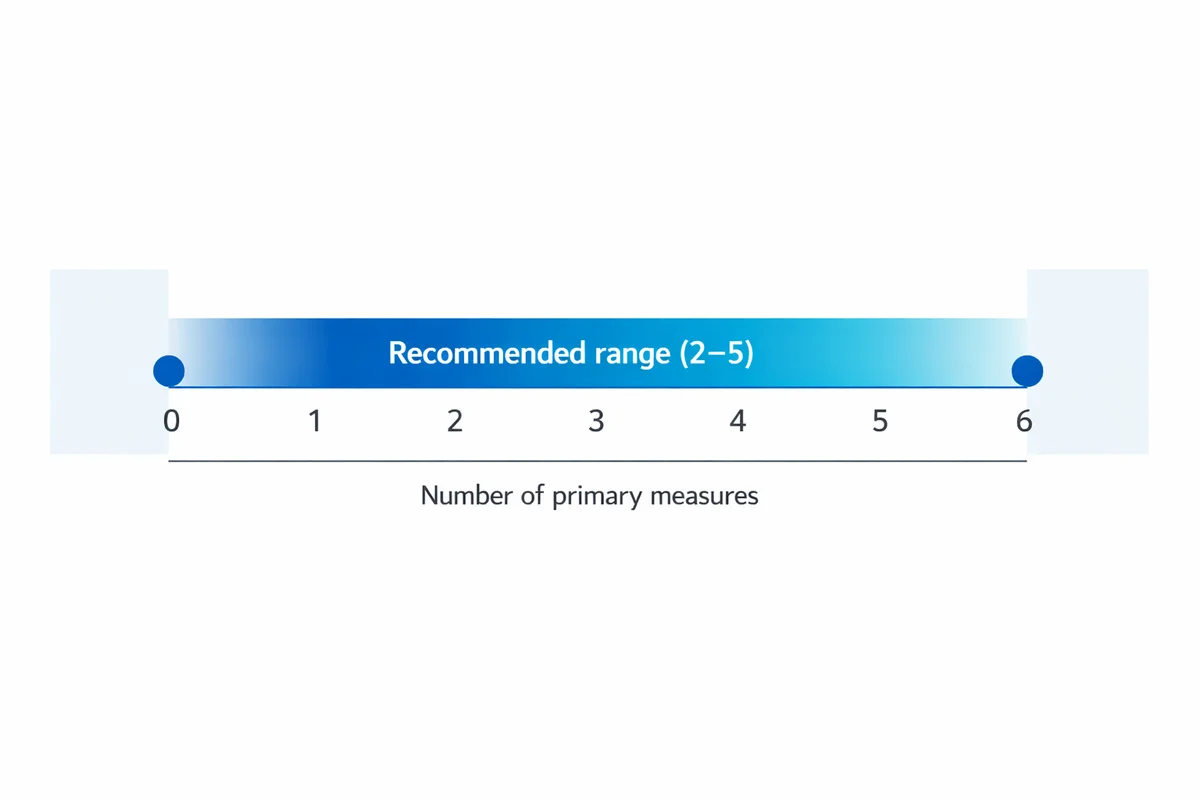
Define 2-5 primary measures (your "must-have" questions) before you write anything else. Then list secondary measures you would like to know but can live without.
If you are starting from scratch, it can help to begin with survey templates and customize only what you need. For business contexts, scan business survey templates to see common objectives and question patterns.
| Plan element | What to write | Example |
|---|---|---|
| Objective | One sentence: what you want to learn | Identify the top 3 drivers of support ticket dissatisfaction |
| Population | Who you want results to represent | Customers who contacted support in the last 30 days |
| Key metrics | 2-5 measures you will report | CSAT, time-to-resolution perception, effort, open-text themes |
| Action thresholds | What result triggers action | If CSAT < 80% for a queue, audit staffing and macros |
| Field plan | Channel, timing, reminders, incentive | Email within 24 hours; 1 reminder after 3 days |
| Analysis plan | How you will summarize and share | Dashboard + 1-page readout; owners assigned per theme |
Step 2: Choose who to survey (sampling) and how many responses you need
Two surveys with identical questions can produce very different results depending on who was invited and who responded. If you need results to represent a group, treat sampling as a core design task, not an afterthought.
Start with sampling basics: define the population, the list you will invite (your sampling frame), and what might be missing. Public guidance on sample design emphasizes documenting the target population and how the sample will be drawn (see the U.S. Census Bureau standard on developing a sample design: Statistical Quality Standard A3).
Next, estimate how many completes you need using your precision needs (how tight you want estimates) and your planned comparisons (for example, department A vs department B). If you are unsure, start with a sample size estimate and work backward to invitations using an expected response rate.
- Plan for nonresponse: If only certain people respond, your results may be biased even with a large sample.
- Decide your key cuts: If you must report by region, ensure enough completes per region (or simplify reporting).
- Avoid convenience-only conclusions: Link-on-social results can be useful, but treat them as directional unless you control who answers.
Step 3: Pick a survey tool and set up your project
Use a platform that makes it easy to build, test, and analyze in one place. If you are ready to start, you can create a survey right away, or explore a survey maker that supports common needs like skip logic, mobile-friendly layouts, and export options.
When choosing an online survey tool, check these practical requirements:
- Logic you can audit: Branching and piping are only helpful if you can easily verify every path.
- Response quality controls: Options like required questions, randomization (when appropriate), and duplicate protection.
- Privacy features: Clear settings for anonymous links vs tracked invitations and data retention.
Step 4: Outline the questionnaire (order, flow, and length)
Before writing wording, sketch your survey sections in the order respondents will experience them:
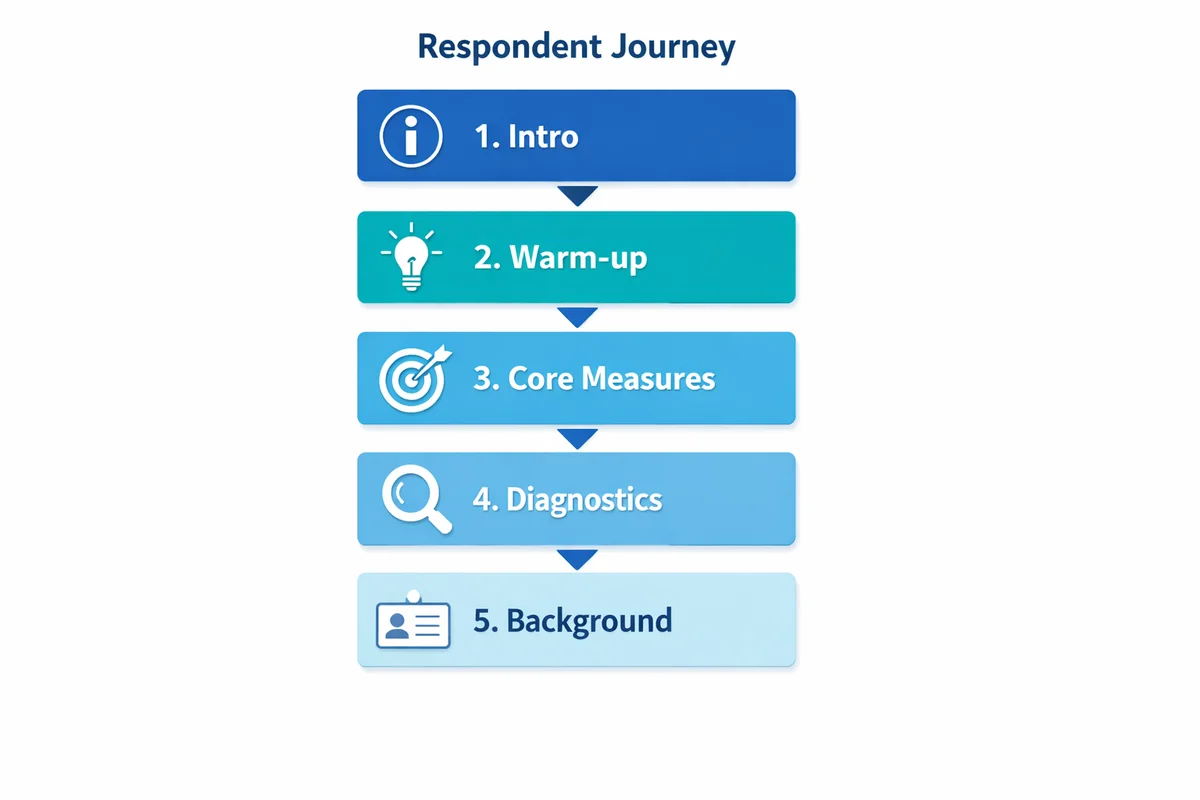
- Intro: purpose, time estimate, privacy statement, and (if needed) consent.
- Warm-up: easy factual or general questions that get people started.
- Core measures: the questions tied to your objective.
- Diagnostics: follow-ups that explain the core measures (drivers and details).
- Background: demographic questions and classification items, usually near the end.
- Close: optional contact permission and a thank-you message.
Keep surveys as short as your objective allows. Research-based guidance consistently recommends limiting length and burden to reduce breakoffs and satisficing (see general design guidance from NYU Libraries and the University of Minnesota).
If a question will not change a decision, remove it or move it to a follow-up study.
Step 5: Write better questions (clarity, bias, and answerability)
Good items are specific, neutral, and easy to answer from memory. If you want a deeper playbook, follow the dedicated guide on how to write survey questions.
Use these practices while drafting:
- One idea per question: Avoid double-barreled items ("The website is fast and easy to use").
- Make timeframes explicit: "In the last 30 days" beats "recently".
- Reduce guesswork: Ask about experiences people can recall; avoid asking for exact counts if respondents will estimate.
- Use plain language: Replace internal jargon with the respondent's words.
Also watch for response bias. Leading wording, loaded terms, and social desirability pressure can shift results even when your sample is strong. AAPOR's best-practices guidance emphasizes transparency and careful instrument design to reduce avoidable error (AAPOR Best Practices for Survey Research).
| Problem | Risk | Better rewrite |
|---|---|---|
| Leading wording | Inflates agreement | "How satisfied are you with the checkout process?" (not "How great was...") |
| Double-barreled | Unclear interpretation | Split into two items: "The agent was knowledgeable" and "The agent was courteous" |
| Undefined timeframe | Mixed reference periods | "Thinking about your last visit (within 90 days)..." |
| Missing response options | Forces bad data | Add "Not applicable" or "I did not use this" when appropriate |
Step 6: Design scales and answer options that measure consistently
Scales are where many surveys quietly fail: inconsistent direction, unlabeled midpoints, or response options that overlap. If you use agree/disagree items, build them carefully and keep them consistent across the survey. See the basics of a Likert scale and practical guidance on rating scale questions.
Practical scale decisions to make up front:
- Number of points: 5 or 7 are common for attitude measures; use fewer points when respondents have low familiarity.
- Labeling: Always label endpoints; consider labeling every point if misinterpretation is likely.
- Direction: Keep "positive" on the same side throughout (for example, 1 = Very dissatisfied, 5 = Very satisfied) to reduce mistakes.
- Include "Not applicable" when real: Do not force a rating for something some respondents did not experience.
For multiple-choice items, ensure options are mutually exclusive and collectively exhaustive. If respondents may choose more than one, say "Select all that apply" and anticipate that percentages can exceed 100%.
Step 7: Use open-ended questions sparingly (and plan how you will analyze them)
Open-ended questions can reveal unexpected issues and useful language for future closed-ended items. But they create analysis work and can lower completion rates if overused.
A practical pattern is:
- One open-text question near the end: "What is the main reason for your rating?"
- Optional targeted follow-up only for key segments (for example, low satisfaction responses).
Before launch, decide whether you will code themes manually, use a simple tagging scheme, or only pull illustrative quotes. If you do not have time to analyze text, do not collect lots of it.
Step 8: Write the survey introduction (trust, consent, anonymity)
Respondents decide whether to participate based on trust and effort. A short, clear introduction can raise completion and reduce breakoffs.
Include:
- Purpose: why you are asking and how results will be used.
- Time estimate: be honest.
- Privacy statement: whether the survey is anonymous or confidential (not the same thing).
- Voluntary participation: especially for employee and sensitive surveys.
For deeper guidance on data handling, consent language, and anonymous settings, see survey privacy. Ethics and administration practices are also covered in survey-methods guidance like AHRQ CAHPS Survey Design and Administration.
Small wording choices in introductions and questions can change how safe people feel answering.
AHRQ CAHPS survey methods guidance
Step 9: Build the survey (templates, logic, and mobile-first formatting)
Now implement the draft in your tool. If you want to move quickly, start from ready-made survey templates and edit the wording to fit your objective. For people-related research, browse employee feedback survey templates (for example, engagement, pulse checks, onboarding, and exit surveys).
If your goal is customer feedback, use a short starting point like a customer satisfaction survey template and add only the diagnostics you truly need.
Build with these implementation tips:
- Mobile-first layout: Avoid large grids; keep one question per screen when possible.
- Logic with purpose: Use skip logic to reduce burden, but keep the number of paths manageable for QA.
- Progress feedback: A simple progress indicator can reduce drop-off in longer surveys.
If you are building in SuperSurvey, you can start a new survey and then choose whether to build from scratch or adapt a template. When you need an all-in-one platform, use the online survey tool to set up logic, preview on mobile, and prepare analysis views.
Step 10: Test and pilot before you send
Testing is where you protect your data quality. Do two passes:
Technical QA
Check every skip path, piping, required settings, and device view. Confirm the survey collects what you think it collects.
Pilot (soft launch)
Send to a small group from the real audience. Ask them what felt confusing, missing, or hard to answer.
Data-quality guidance generally recommends preventing and detecting errors early in the lifecycle, not just fixing issues after collection (see GSA Data Quality Guidelines for a government example of quality principles).
Step 11: Send the survey (invitations, reminders, and response-rate tactics)
Distribution is not just "share a link." Your invitation, timing, and reminder strategy can determine who responds and how quickly you reach your target.
Choose a channel that matches the audience:
- Email: best when you have a clean list and want controlled invitations.
- In-app or web intercept: good for immediate experience feedback (after a task).
- SMS: can work well for short surveys with clear consent expectations.
- QR codes: useful in physical locations; keep surveys very short.
Write invitations that are specific and respectful. Here is a copy-ready structure:
Subject: 3-minute feedback on [topic]
Body: We are improving [process/product]. This survey takes about [X] minutes. Your responses are [anonymous/confidential] and will be used to [how]. Please respond by [date]. [Link]
Close: Thank you, [name/team].
Plan reminders as part of the fieldwork, not as a last resort. One or two reminders is common; vary the subject line and shorten the message. If you offer incentives, use them to reduce burden (not to pressure people). Ensure the incentive does not conflict with anonymity promises.
If you are surveying employees, be extra clear about how responses will be used and who can see them. Consider using established employee survey templates to match common expectations for anonymity and follow-up.
Step 12: Monitor responses during collection (quality and coverage)
While the survey is live, watch for issues that can invalidate results:
- Drop-off points: If many people quit on one question, it may be confusing, too sensitive, or too much work.
- Speeders and straight-liners: Extremely fast completions or identical answers across grids can indicate low effort.
- Coverage gaps: If one segment is underrepresented (for example, night shift), adjust outreach and timing.
For higher-stakes studies, publish a brief methodology note with your reporting. Organizations like Pew Research Center document methods and limitations to improve interpretability (Pew Research Center Methods).
Step 13: Clean, analyze, and turn results into actions
Competitors often stop at "review results." The difference between a helpful survey and a forgettable one is what you do next.
Start with basic cleaning:
- Remove obvious test entries and duplicates (if your collection method can create them).
- Decide how to handle partial completes (keep them for early questions if useful).
- Check missing data patterns (missingness can be a signal, not just a nuisance).
Then summarize:
- Overall distributions: percentages, averages (for scales), and confidence intervals when appropriate.
- Key cuts: compare your pre-defined segments (role, tenure, region) if you have enough sample per group.
- Drivers: look for which experiences correlate with your key outcome (for example, satisfaction vs wait time rating). Keep interpretation cautious if your sample is small.
For open text, code themes and quantify them (even a simple tag system helps). Pull 3-5 representative quotes per theme, not only the most extreme comments.
Finally, create an action plan that is visible:
- Top 3 findings (what matters most)
- What you will change (specific actions)
- Who owns each action and the due date
- What you will measure next time to verify improvement
If you want a practical walkthrough of reporting and interpretation, see analyze survey data for a beginner-friendly approach to turning responses into insights.
Copyable mini-templates (customer + employee examples)
Below are two short, practical blueprints you can copy and adapt. Keep them short until you have proven you can get participation and act on results.
| Use case | Question set (example) | Notes |
|---|---|---|
| Customer satisfaction (CSAT) |
| Start from a CSAT survey template. Trigger it right after the interaction for better recall. |
| Employee pulse (temperature check) |
| Use employee survey templates and keep it anonymous when trust is low. Keep the schedule consistent. |
For broader use cases (brand, product, operations), scan business survey examples to see how other teams structure short, actionable questionnaires.
Pre-launch checklist (10 minutes that saves weeks)
- Objective is specific: A teammate can explain what decision the survey supports.
- Sample is defined: You know who is invited and who might be missing.
- Must-have questions are first: Core measures appear before long diagnostics.
- Scales are consistent: Same direction, labeled endpoints, and "N/A" where needed.
- Sensitive items are justified: You can explain why you need each sensitive demographic item (see demographic information to collect).
- Privacy statement is accurate: Anonymous vs confidential is correct (see anonymous surveys and data protection).
- Logic tested end-to-end: Every path works and yields the right question set.
- Invitation and reminder drafted: Clear timing, deadline, and contact point for questions.
- Analysis plan exists: You know what charts/tables you will produce and for whom (see survey data analysis basics).
- Close-the-loop plan exists: You have a way to share results and actions with respondents.
References
- American Association for Public Opinion Research (AAPOR). (2023). Best Practices for Survey Research.
- New York University Libraries. (n.d.). Survey Design Guidance.
- University of Minnesota Information Technology. (n.d.). Survey Design.
- U.S. Census Bureau. (2021). Statistical Quality Standard A3: Developing and Implementing a Sample Design.
- Agency for Healthcare Research and Quality (AHRQ). (n.d.). CAHPS: Survey Design and Administration (Survey Methods Research).
- U.S. General Services Administration (GSA). (2024). Data Quality Guidelines.
- Pew Research Center. (n.d.). Our Methods.
Frequently Asked Questions
How long should a survey be?
As short as you can make it without losing decision-critical measures. Start with your 2-5 must-have questions, then add diagnostics only if you will use them. If you need a longer questionnaire, consider splitting it into two phases (a short pulse now, a deeper follow-up later).
Should my survey be anonymous or confidential?
Anonymous means you cannot link responses to identities. Confidential means you can link them internally, but you restrict access and report results in aggregate. Use anonymous collection when fear of retaliation or social desirability is likely (common in employee feedback). Just make sure your incentive and follow-up process does not accidentally break anonymity.
How many responses do I need for a survey?
It depends on how precise you need estimates to be and which subgroups you must compare. Use a sample size for surveys estimate, then work backward using a realistic response-rate assumption to determine how many invitations to send.
Are incentives a good idea?
Sometimes. Incentives can reduce nonresponse, especially for longer surveys or hard-to-reach audiences. Use modest incentives, keep the offer simple, and avoid creating pressure for sensitive topics. If you promise anonymity, design incentive delivery so you do not tie identities to answers.
What is the biggest mistake people make when creating a survey?
Asking questions without a plan for how results will be used. If you cannot name the decision owner and the action the data will inform, you will likely collect "interesting" data that does not get acted on.