
Key Takeaways
- Response bias is systematic: It happens when answers are consistently pushed high/low or toward certain options (not just random noise).
- Most bias is preventable in design: Neutral wording, balanced options, good Likert scale and rating scale design, and thoughtful order reduce predictable distortions.
- Privacy changes what people admit: Clear anonymity and confidentiality language and careful placement of sensitive demographic questions can reduce socially desirable answers.
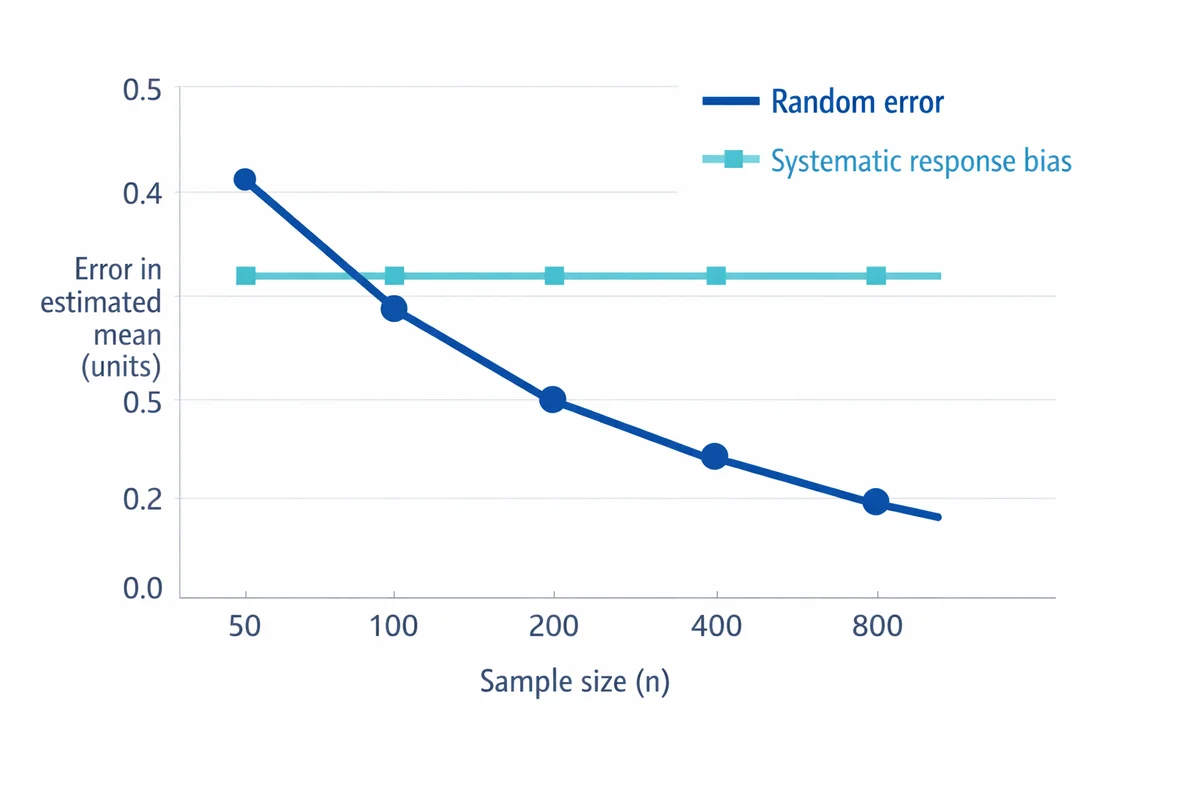
- Bigger samples do not fix bias: More responses shrink random error, but systematic response patterns can remain (or become more precisely wrong).
- Have an after-the-fact plan: Use survey data quality checks to detect suspicious patterns, then run sensitivity analyses and report limitations rather than "correcting" results blindly.
Response bias: meaning (in one clear definition)
Response bias is a systematic pattern of answering that distorts survey or research results. People still respond, but their answers are pulled in a predictable direction (for example: overly positive, overly negative, always choosing the middle, or agreeing with statements regardless of content).
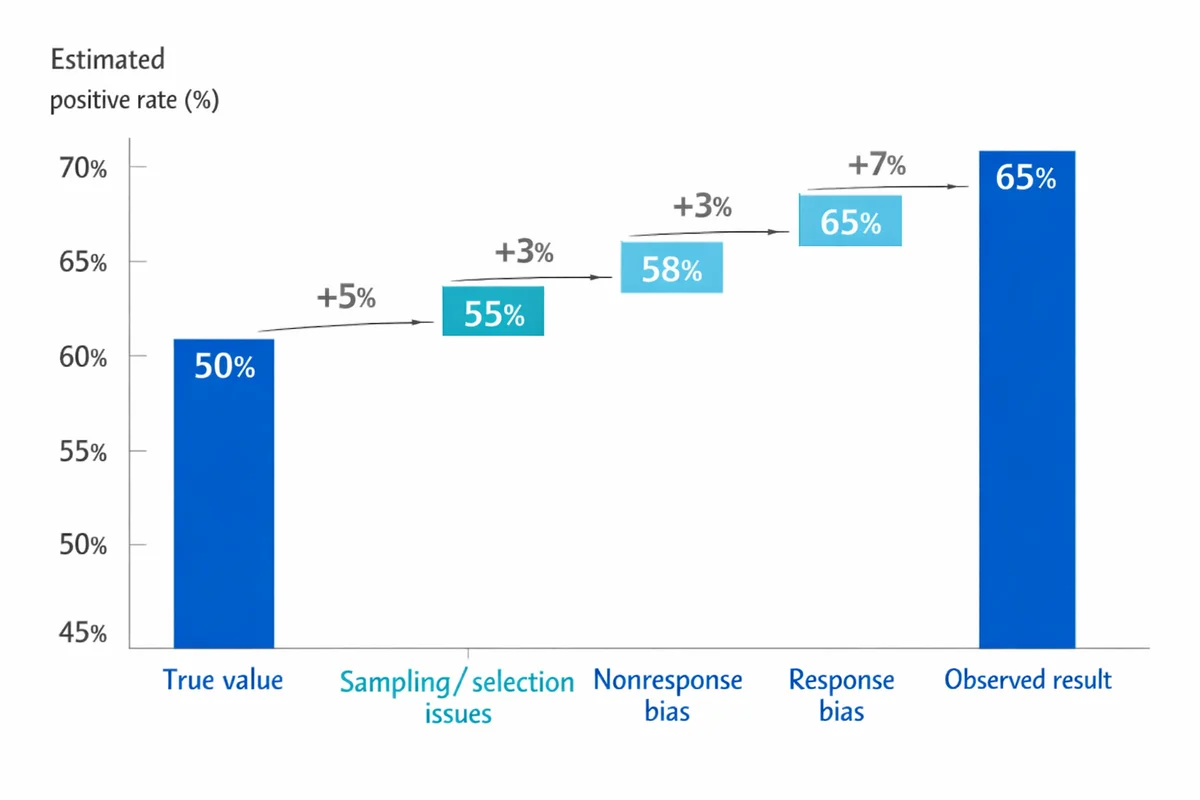
This matters because response bias is not random. It can change averages, inflate correlations, and make group comparisons misleading. Research reviews in applied assessment describe response bias as a meaningful source of measurement error, not a rare edge case (McGrath et al., 2010).
Random error makes answers "noisy." Response bias makes answers "tilted." More sample size reduces noise, but it does not automatically remove the tilt.
Response bias vs nonresponse bias (and other common mix-ups)
These terms sound similar but point to different problems:
| Concept | What goes wrong | Example | What usually helps |
|---|---|---|---|
| Response bias | People answer, but answers are systematically skewed. | Employees over-report compliance because it feels expected. | Neutral wording, privacy, better scales, order control. |
| Nonresponse bias | Some people do not respond, and nonresponders differ from responders. | Only highly engaged customers complete a feedback survey. | Better follow-up, mixed modes, incentives, weighting (when justified). |
| Sampling/selection issues | You asked the wrong group or missed key segments. | Surveying only day-shift staff about workplace safety. | sampling basics (coverage, frames, quotas). |
Nonresponse bias is a major issue in many surveys, but it is about who answers, not how answers are shaped. A classic review shows that response rates and nonresponse bias are related in complicated ways, so you should evaluate bias directly rather than assuming a low response rate automatically ruins the data (Groves & Peytcheva, 2008).
Also, do not confuse response bias with simple disagreement or true extreme opinions. Bias is about a systematic pull away from what people would report under better measurement conditions.
Common types of response bias (with simple examples)
Many articles list long taxonomies. For practical survey work, it is more useful to recognize the handful of patterns that show up repeatedly and know what triggers them.
| Type | What it looks like | Simple example | Common triggers |
|---|---|---|---|
| Social desirability | Answers shift toward what seems acceptable or "good." | Under-reporting policy violations; over-reporting healthy habits. | Sensitive topics, fear of judgment, low trust in privacy (Furnham, 1986). |
| Acquiescence (yea-saying) | High agreement across many statements, even conflicting ones. | Agreeing with both "I get enough feedback" and "I rarely get feedback." | Agree/disagree grids, low effort, authority cues. |
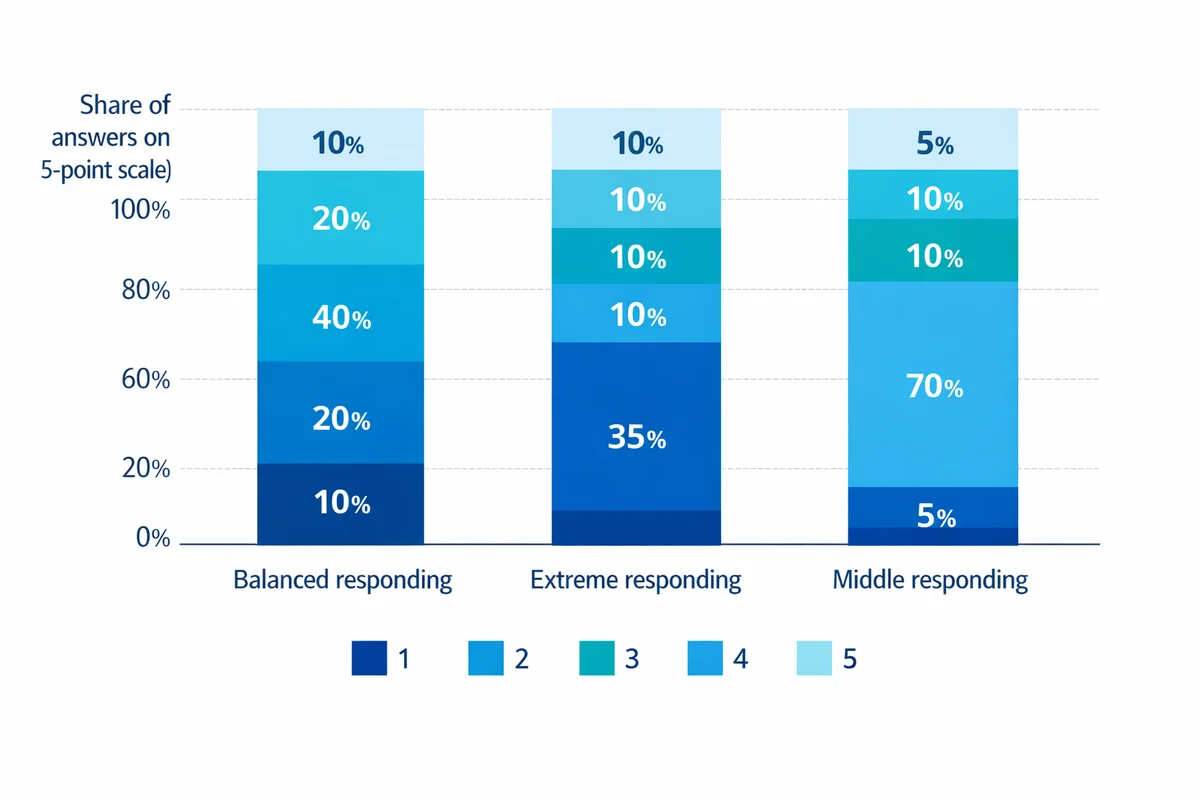
| Extreme responding | Overuse of endpoints (e.g., 1 or 5 on a 5-point scale). | Rating everything "Very satisfied" or "Very dissatisfied." | Ambiguous items, strong emotions, some cultural response styles. |
| Neutral / middle responding | Overuse of the midpoint or "Neither" option. | Selecting "3" repeatedly to avoid taking a stance. | Unclear question, low relevance, fear of consequences. |
| Demand characteristics | Respondents infer the "right" answer and comply. | After a training, rating it highly because the trainer is watching. | Leading intros, cues about desired outcomes. |
| Recall and estimation bias | Errors from memory and rough guessing. | Misreporting last-month spend or number of incidents. | Long recall periods, hard-to-count behaviors. |
| Satisficing / straightlining | Fast completion, repetitive patterns, low differentiation. | Choosing the same option down a matrix/grid. | Long surveys, repetitive items, poor mobile layout. |
What causes response bias in surveys
Most response bias comes from a small set of root causes. If you fix these, many named bias types shrink at the same time.
- Motivation and effort: If the survey is long, boring, or irrelevant, people satisfice (minimum effort) and you see straightlining, speeding, and random clicks.
- Perceived risk: If a question feels sensitive or "traceable," social desirability rises and item nonresponse increases (skips).
- Ambiguity: Vague terms ("often," "good," "fair") force respondents to invent their own scale.
- Framing and context: Earlier questions prime later ones; the intro signals what answers are wanted.
- Response option design: Unbalanced or overlapping choices quietly push answers in one direction.
One underappreciated outcome: response bias can even inflate reliability metrics (scores look consistent, but consistently biased). A paper on questionnaire reliability describes how response bias can make measures look "too reliable to be true" (Peer & Gamliel, 2011).
Prevent response bias with better question wording and answer choices
Wording is where most preventable response bias starts. If you want a deeper, end-to-end guide, use our resources on how to write survey questions and writing unbiased survey questions.
Wording fixes that work in real surveys
- Remove implied judgment: Replace "How often do you fail to..." with "How often does X happen?"
- Ask one thing at a time: Double-barreled questions create "compromise" answers.
- Use concrete timeframes: "In the last 7 days" beats "recently."
- Use neutral verbs: "Prefer" and "choose" are less loaded than "support" or "believe."
- Match the respondent's knowledge: If they cannot know it, you will get guesswork.
Answer choice traps (especially in multiple choice)
Response options can steer answers even when the question stem looks fine. Watch for:
- Unbalanced options: 3 positive choices and 1 negative choice invites positivity.
- Overlapping ranges: "1-3" and "3-5" forces arbitrary picks.
- Missing plausible answers: Respondents choose the "least wrong" option.
See our guide to multiple-choice questions, including how to build multiple-choice response options that are mutually exclusive and collectively exhaustive.
If none of your options fits a real situation, you are not measuring attitudes -- you are measuring how well people can "make do" with your list. Consider adding an "Other (please specify)" or using open-ended questions to capture the missing reality.
Reduce bias from rating scales (acquiescence, extremes, and middle answers)
Scale design can trigger response styles: always agreeing, always choosing endpoints, or always choosing the middle. Good scale decisions will not eliminate response bias, but they can reduce predictable distortions.
Practical scale choices
- Use fully labeled endpoints: Label what "1" and "5" mean; consider labeling every point for high-stakes items.
- Decide whether you truly want a midpoint: A midpoint can be "neutral," "unsure," or "not applicable" depending on context. If those meanings differ, split them into separate options.
- Keep direction consistent: Switching "high is good" and "high is bad" increases mistakes and satisficing.
- Be cautious with agree/disagree grids: They often amplify acquiescence and straightlining.
For more detail, see our Likert scale guide, including Likert scale best practices, and our recommendations on rating scale design to avoid scale bias.
Use privacy, anonymity, and placement to reduce social desirability
Social desirability bias happens when people shape answers to look better, safer, or more acceptable. It is common in employee surveys, compliance topics, health behaviors, and anything that feels like it could be used against the respondent (Furnham, 1986).
Design moves that reduce fear-based responding
- Say exactly what is anonymous vs confidential: "Anonymous" means you cannot link responses back to a person. "Confidential" means you can, but you will protect identities. Pick one and describe it plainly.
- Minimize identifying combinations: Job title + team + location can re-identify people in small groups. Aggregate where needed.
- Place sensitive items later (usually): Let trust build first, then ask sensitive questions.
- Explain why you ask: A one-line rationale reduces suspicion.
Use our guide to survey privacy and protecting respondent privacy to write a privacy statement that respondents will actually understand.
Demographics are a frequent trigger for social desirability and drop-off. Follow demographic question best practices and consider offering "Prefer not to say" for sensitive fields. See collecting demographic information for placement and phrasing guidance.
Control order effects, context, and "priming"
Even when individual questions are well written, the sequence can create response bias. Earlier questions can prime a frame (for example: making cost salient before asking about value). The fix is rarely "randomize everything." It is thoughtful structure.
Group by topic, not by emotion
Keep items about the same concept together, but avoid stacking highly negative prompts at the top (it can shift the tone of the entire survey).
Use block randomization where it is safe
Randomize within a block of similar items (for example, product feature ratings), but keep "screeners" and logic-trigger questions fixed.
Put explanations before the first sensitive item
If respondents need context (definitions, privacy language), give it right before the relevant section, not only in the intro.
Separate "facts" from "opinions"
If you ask people to justify an answer, it can anchor later ratings. Consider asking ratings first, then open text.
Examples: spotting response bias in real questionnaires
Below are common patterns and a cleaner rewrite. Treat them as a quick diagnostic when reviewing a draft.
| Pattern | Biased version | Better version |
|---|---|---|
| Leading language | "How helpful was our excellent support team?" | "How helpful was our support team?" (Not at all helpful ... Extremely helpful) |
| Agree/disagree trap | "I receive timely feedback." (Strongly disagree ... Strongly agree) | "How timely is the feedback you receive?" (Not timely ... Very timely) |
| Missing option | "Which feature do you use most? A/B/C" | Add "I do not use these" and/or "Other (specify)" (open-text responses to reduce bias can help) |
| Too much recall | "How many times did you contact support in the last year?" | "In the last 30 days, about how many times..." plus ranges |
If you are doing a full rewrite, start with survey question wording tips and then audit your response options using avoid biased answer choices.
After data collection: how to detect suspected response bias
Prevention is cheaper than repair. But response bias is often discovered after results look "too good" or conflict with other evidence. Here are practical checks you can run using your survey data quality workflow.
- Speeding: Very short completion times relative to the median can signal low-effort responding.
- Straightlining in grids: Identical responses across many items that should vary.
- Contradictions: Logical conflicts (e.g., "I never use the product" but later rating advanced features).
- Heaping and spikes: Unusually high piles on 0/5/10 or the midpoint can indicate scale-driven response style.
- Too-consistent scales: Reliability or inter-item correlations that seem implausibly high can be inflated by response patterns rather than true consistency (Peer & Gamliel, 2011).
Also check for mode effects (phone vs web), interviewer effects, and changes by device type. Privacy perceptions differ by mode, which can shift social desirability.
Compare early vs late respondents. It is not a perfect proxy for nonresponders, but it can reveal whether results drift as reminder waves go out (which may indicate a response bias or a changing mix of respondents).
What to do if you suspect response bias (without overcorrecting)
There is no universal "bias correction" button. The safest approach is to (1) document what you found, (2) run sensitivity checks, and (3) improve the next measurement.
1) Treat it as a measurement issue, not just a data-cleaning issue
If a question invites social desirability or acquiescence, deleting a few "bad" respondents rarely fixes the underlying distortion. Response bias is often systematic across many respondents (McGrath et al., 2010).
2) Run sensitivity analyses (quick, honest, and defensible)
- Recompute key results after excluding low-effort cases: For example, remove the fastest 1-2% and strong straightliners. If decisions change, report both versions.
- Compare question formats: If you asked both a rating and an open-ended question, check whether the themes match. A gap can indicate social desirability in the ratings.
- Split by privacy condition (if you have it): Anonymous vs identified groups can show the size of social desirability effects.
3) Use cautious adjustments only when you can justify them
Weighting can help when bias is due to an imbalanced sample or differential response patterns, but it requires clear assumptions. If the problem is response style (e.g., extreme responding), statistical modeling may help in specialized contexts, but most business surveys are better served by redesign and replication rather than heavy adjustments.
For high-stakes measurement, the research literature continues to develop methods to address pervasive self-report response bias (Grimmond et al., 2025). The practical takeaway: if the decision is high-impact, plan for validation (multiple measures, follow-ups) rather than relying on a single self-report metric.
4) Close the loop with a follow-up measurement
When bias is suspected, the most credible fix is often a short follow-up survey with improved wording, clearer privacy language, and a better scale. If you need help redesigning quickly, use our survey help and survey methodology help resources to troubleshoot the instrument, not just the dataset.
Mini case (illustrative): how one design change can shift results
The scenario below is illustrative (not a published dataset). It shows the kind of change you should expect when a survey removes a strong bias trigger.
Situation: An internal compliance survey asked, "I always follow the process." The survey was sent from a manager, and respondents believed answers could be traced. Results were near-uniform agreement, but incident logs contradicted that picture.
Change: The team rewrote the item into a frequency question with a defined timeframe, added explicit anonymity and confidentiality language, and moved demographic questions to the end.
| Metric | Initial survey | Revised survey | Interpretation |
|---|---|---|---|
| % choosing top-box | Very high | Lower, more spread | Less pressure to present as perfect |
| Open-text flags | Few | More specific issues | Higher willingness to disclose |
| Completion time | Very fast cluster | More consistent | Less satisficing after shortening grids |
Lesson: When design reduces fear and ambiguity, results often become less "pretty" but more actionable.
Quick self-test: can you spot the bias?
Choose the most biased item (the one most likely to produce response bias):
- A. "How satisfied are you with your manager's communication?" (Very dissatisfied ... Very satisfied)
- B. "My manager communicates clearly." (Strongly disagree ... Strongly agree)
- C. "How satisfied are you with your manager's clear, effective communication?" (Very dissatisfied ... Very satisfied)
Answer: C is the most biased because it bakes in a positive evaluation ("clear, effective"). B is not necessarily biased, but agree/disagree formats can increase acquiescence and straightlining. A is usually the safest of the three when paired with a well-designed scale.
Response bias prevention checklist (before you launch)
- Audit wording: No loaded adjectives, no double-barreled items, and timeframes are explicit (how to write survey questions).
- Audit response options: Balanced, non-overlapping, and includes realistic alternatives (avoid biased answer choices).
- Audit scales: Appropriate midpoint handling, labeled endpoints, consistent direction (using Likert scales without bias; choose the right rating scale).
- Reduce social pressure: Clear privacy statement and safe placement of sensitive items (survey privacy; demographic questions).
- Control order effects: Use block randomization where appropriate; avoid priming sections.
- Right-size expectations: A larger sample size helps precision, but it does not eliminate systematic response bias.
References
- Bayley, A., Stahl, D., Ashworth, M., et al. (2018). Response bias to a randomised controlled trial of a lifestyle intervention in people at high risk of cardiovascular disease: A cross-sectional analysis. BMC Public Health, 18, 1092.
- Peer, E., & Gamliel, E. (2011). Too reliable to be true? Response bias as a potential source of inflation in paper-and-pencil questionnaire reliability. Practical Assessment, Research, and Evaluation, 16(1), Article 9.
- Furnham, A. (1986). Response bias, social desirability and dissimulation. Personality and Individual Differences, 7(3), 385-400.
- Grimmond, J., Brown, S. D., & Hawkins, G. E. (2025). A solution to the pervasive problem of response bias in self-reports. Proceedings of the National Academy of Sciences, 122(3), e2412807122. (PubMed record).
- McGrath, R. E., Mitchell, M., Kim, B. H., & Hough, L. (2010). Evidence for response bias as a source of error variance in applied assessment. Psychological Bulletin, 136(3), 450-470. (PubMed record).
- Groves, R. M., & Peytcheva, E. (2008). Nonresponse rates and nonresponse bias in household surveys. Public Opinion Quarterly, 70(5), 646-675.
- Adida, C., Gottlieb, J., Kramon, E., & McClendon, G. (2019). Response bias in survey measures of voter behavior: Implications for measurement and inference. Journal of Experimental Political Science, 6(3), 192-198.
Frequently Asked Questions
Is response bias the same as nonresponse bias?
No. Response bias happens when people do answer but their answers are systematically skewed. Nonresponse bias happens when some people do not answer and nonresponders differ from responders in ways that matter. They can occur together, so diagnose both.
Does increasing sample size fix response bias?
Usually not. Larger samples reduce random sampling error, but response bias is systematic. You can end up with a very precise estimate of a biased value. Use sample size guidance for precision, and use design and privacy tactics to reduce bias.
How do I know if social desirability is affecting my results?
Look for overly positive distributions on sensitive items, low variance, and contradictions with other data sources. Compare identified vs anonymous conditions when possible, and review whether your anonymity and confidentiality language is believable and specific.
What question format is least likely to create response bias?
No single format is always best. In practice, bias is reduced by clear, specific wording and well-designed response options. For attitudes, item-specific rating questions often outperform agree/disagree grids. For complex topics, adding open-ended questions can reveal nuance that ratings hide.
Can I "fix" response bias after the survey is finished?
You can often reduce its impact, but you should be cautious. Start with diagnostics (speeding, straightlining, contradictions) and rerun key results with and without low-effort cases. Report limitations, then improve the next wave. If the decision is high-stakes, consider getting survey methodology help.